Global Warming, Where do you stand? Poll

Is global warming/climate change real and happening?

  • Yes

    Votes: 253 74.6%
  • No

    Votes: 86 25.4%

  • Total voters
    339
Status
Not open for further replies.

Randy Holmes-Farley

Reef Chemist
View Badges
Joined
Sep 5, 2014
Messages
68,319
Reaction score
64,818
Location
Arlington, Massachusetts, United States
Rating - 0%
0   0   0
Im Disappointed you would just side with the majority and not be able to see through the rubbish...but everyone is certainly entitled to their own opinion.....
Not sure where the alien thing came from. However, I cannot say I believe in that either.

lol

I choose to believe the very great majority of scientific experts. Nothing you or anyone else in this thread is posting is something they do not already know, understand, and account for in developing models.
 

Waterjockey

Well-Known Member
View Badges
Joined
Mar 30, 2016
Messages
646
Reaction score
561
Rating - 0%
0   0   0
Sorry, I don't see conflicting statements, but there is zero debate that sea level is rising slowly. Folks might debate the future, or the exact amount it has risen based on different types of measurement methods, but the past 100 years showing a rise are not seemingly in debate.

As I mentioned earlier, that does NOT mean it is rising everywhere relative to the local land because local land can be rising or falling. It also does not mean it rises at the same rate all the time.

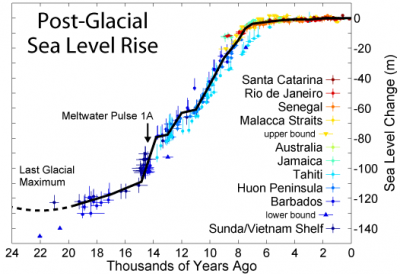
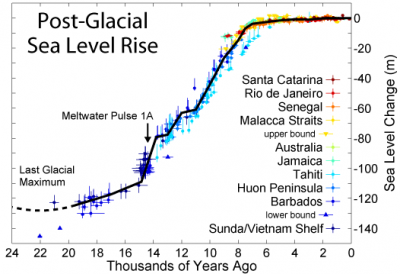
Agreed. I don't dispute the overall trend is towards rising sea levels. But it's a good example of cherry picking trends, and media bias. If this was the 70's and global cooling was all the rage, the media would be all over the last two years as proof that a new ice age had begun. Speaking of cherry picking trends, you notice NASA including links to media articles saying how rate of rise was accelerating, etc......and yet when you look at the longer term, and probably far more relevant trend than the last 100 years, it would appear that mean global sea levels are exceedingly stable, and a more accurate statement would be that the rate of sea level rise has been decreasing for 8000 years, and has for all intents and purposes, more or less flat-lined (graph attached). This is the crux of my issues with claimed anthropogenic climate change..cherry picking specific timeframes as supporting evidence.

I'm glad you stated that it doesn't rise at the same rate all the time....there are local or regional variations as well (along with things like isostatic rebound, sinking land masses, etc). Someone on this thread was dismissed for stating that sea levels had fallen recently around the Great Barrier Reef (the area of topic for this thread), and that contributed to coral bleaching as well....and the global sea rise trend was quoted as evidence this was wrong. Well, their statement was true. Due to El Nino events there had been a regional downward trend along with the Indonesian reefs. Gauges near Lizard Island showed as much as 15 cm lower during low tide. After decades of higher sea levels, vertical coral growth and colonization of submerged coast line had occurred.....sea level drops 10-15 cm....and surprise...mass bleaching event. But this is held as unquestionable proof of man made global warming.

Post-Glacial_Sea_Level.png
 

Waterjockey

Well-Known Member
View Badges
Joined
Mar 30, 2016
Messages
646
Reaction score
561
Rating - 0%
0   0   0
Are you referring to the dip highlighted in the red circle in the first image?

If so that seems in line with the overall graph showing a steady increase over time doesn't it? I mean if you look back down the graph there are plenty of dips but the overall trend still seems remarkably clear.

I would also say that, if I were to want to use that bit of data as a counter argument to all of the other sea is rising evidence, I would want a more detailed chart and analysis...

I used this same chart (attached) in a reply to someone else. Yes, looking at only 100 years or so, it would suggest the overall trend is in a rapidly rising upward direction. But is that any more/less relevant than looking at a trend of the last two years, given what a trend of the last 20,000 years shows? The attached trend would indicate more or less pretty stable levels, it's all in what you consider a relevant time frame, or where you choose to start/end exceedingly short term trends (in geological timescales), and what scale you choose on the vertical axis.

Post-Glacial_Sea_Level.png
 

Randy Holmes-Farley

Reef Chemist
View Badges
Joined
Sep 5, 2014
Messages
68,319
Reaction score
64,818
Location
Arlington, Massachusetts, United States
Rating - 0%
0   0   0
I used this same chart (attached) in a reply to someone else. Yes, looking at only 100 years or so, it would suggest the overall trend is in a rapidly rising upward direction. But is that any more/less relevant than looking at a trend of the last two years, given what a trend of the last 20,000 years shows? The attached trend would indicate more or less pretty stable levels, it's all in what you consider a relevant time frame, or where you choose to start/end exceedingly short term trends (in geological timescales), and what scale you choose on the vertical axis.

I'm not sure I understand the point.

Changes in sea level are driven by many factors and those factors apply over many different time frames.

Look at the SCALE! The graph you post does not show stability in recent times, unless your criteria for stability is that the ocean not rise more than 50 feet.

No one is claiming that the rise in the past 100 years is akin to the rise over thousands of years as the ice age glaciers melted and sea level rose by many hundreds of feet. If that were true, even SPSreefs might be concerned. lol
 

Waterjockey

Well-Known Member
View Badges
Joined
Mar 30, 2016
Messages
646
Reaction score
561
Rating - 0%
0   0   0
Yea – it will do that – if there is enough of phosphorus, nitrogen and other nutrient in the soil. Lack of one of them will stop the growth process. And in natural environment – it’s a lack of nitrogen in the first place but even phosphorus is a limited factor. All farmer around the world should be glad if you was right because when they do not need to fertilizes their soil. The first green revolution of the world start with the HaberBosch process back around 1910. To get use of the rising CO2 concentration around the world – you need to fertilize (with N and P) all of the worlds green areas first.


I´m not sure of that – a link to the controlled experiment could help. It´s true that the evaporation from the soil itself will be lower but that is not the major pathway for water vapor transport to the atmosphere linked to plants. The major pathway is the plant itself and the plants system for transporting nutrients from the roots up to the production areas (often the leaves) This is done with water that will be transported by a force referred to as capillary action. The plants have not a return system for the water – instead it leave the plant as water vapor. As an example a large birch (a northern common tree) can transport 2 – 500 liters of water out to the atmosphere a sunny day. You can test this by yourself with your pot plants. Water the soil, take some plastics over the soil itself (not over the plant) and check after some sunny days.

However – in water CO2 can be a limited factor for growth because the gas form of the CO2 complex have a low solubility in water – that’s the reason why I will do some experiment with CO2 gas and my own aquarium in the future. The limited effect of CO2 in water every reefer see every day in its aquarium when the pH swing according to the photosynthesis. In freshwater aquarium (with surplus of all other nutrients) – the normal concentration of the CO2 (gas form) level is limited for plant (and algae growth). So I can give you right in that – the rising CO2 concentration in the atmosphere is good for freshwater aquarists :). In saltwater envorniment - theorethical - the higher CO2 level can favour algae growth (including outbreak like red tide)

Sincerely Lasse

Hi Lassie.
Given this is a reefing forum, I assumed we were all aware of nutrient limiting theory, so I failed to add the caveat, "assuming there are no other limiting factors, increased CO2 levels lead to in increased in rate of biomass accumulation for vegetation as a whole". Plants utilize water more *efficiently* at higher CO2 levels (and therefore require less water per unit mass), there is up to 50% less water *lost* through transpiration at the leaf level with elevated CO2 levels. There are various classes of plants, and the different classes have different percentage response to increased CO2 levels, and my interest was mostly around food crops. The particular pdf I was referring to is on my laptop, I'll post a link to it whenever the kid gets home with it, but this link will do for the purposes of the discussion
http://www.fao.org/docrep/w5183e/w5183e07.htm

In that context, increased CO2 leads to less water loss by plants to the atmosphere.
 

Waterjockey

Well-Known Member
View Badges
Joined
Mar 30, 2016
Messages
646
Reaction score
561
Rating - 0%
0   0   0
I'm not sure I understand the point.

Changes in sea level are driven by many factors and those factors apply over many different time frames.

Look at the SCALE! The graph you post does not show stability in recent times, unless your criteria for stability is that the ocean not rise more than 50 feet.

No one is claiming that the rise in the past 100 years is akin to the rise over thousands of years as the ice age glaciers melted and sea level rose by many hundreds of feet. If that were true, even SPSreefs might be concerned. lol

My point is signal/noise.
The evidence for anthropogenic climate change affecting sea level rise in a manner to which we should react with alarm, or indeed react at all, is weak, or at best, irrelevant, given the planets normal cyclical variations. While current rate of rise may be detrimental to current coastal geography some hundreds or thousands of years down the road, it's hardly a risk which requires immediate and drastic attention or resources. That's not to say we shouldn't continue to study and learn, but there doesn't appear to be any requirement to sound any alarms. 1 foot per century is more noise than signal, but rising sea levels are almost always including in the "evidence" of anthropogenic climate change, including NASA You used what I perceived as an "appeal to authority" argument, citing a NASA statement about climate change. An "appeal to authority" argument is only successful, if both parties recognize the authority as one. i.e., if I cite a particular religious passage as evidence for something in an argument, and the person I am arguing with is an atheist, my appeal to authority (religion) fails to persuade. Given that NASA posts links to articles sounding alarms of catastrophic sea levels rise that *must* be the result of anthropogenic global warming on it's public face, my position is that the public face of NASA is more a political venue than a scientific one and is a weak argument in my humble opinion.
And yes, look at the scale. The scale chosen by the NASA chart certainly seems to imply a rapidly rising level, when in what I consider the more relevant geological scale of perhaps hundreds of feet, it's more noise than signal.
 

Lasse

10K Club member
View Badges
Joined
Mar 20, 2016
Messages
10,955
Reaction score
30,066
Location
Källarliden 14 D Bohus, Sweden
Rating - 0%
0   0   0
Hi Lassie.
Given this is a reefing forum, I assumed we were all aware of nutrient limiting theory, so I failed to add the caveat, "assuming there are no other limiting factors, increased CO2 levels lead to in increased in rate of biomass accumulation for vegetation as a whole". Plants utilize water more *efficiently* at higher CO2 levels (and therefore require less water per unit mass), there is up to 50% less water *lost* through transpiration at the leaf level with elevated CO2 levels. There are various classes of plants, and the different classes have different percentage response to increased CO2 levels, and my interest was mostly around food crops. The particular pdf I was referring to is on my laptop, I'll post a link to it whenever the kid gets home with it, but this link will do for the purposes of the discussion
http://www.fao.org/docrep/w5183e/w5183e07.htm

In that context, increased CO2 leads to less water loss by plants to the atmosphere.

And the authors state

The effects of elevated CO2 alone on transpiration integrated over the season show that any of the cases (higher water use; no change; lower water use) can be found. Especially in the case of non-limiting water supply a higher water use can be expected even with a lower stomatal conductance as leaf area will increase with about the same factor as total biomass. This will compensate for the reduction in water exchange per leaf area. This applies especially in early season. In conditions with transient water shortage, profit from partial stomatal closure will be highest, as both the depletion of soil water reserves is delayed and plant sensitivity to midday water shortage (suppressed photosynthesis) is lessened.

Ie - the effect on the micro level will be overriden by the macro level

Sincerely Lasse
 
Last edited:

Waterjockey

Well-Known Member
View Badges
Joined
Mar 30, 2016
Messages
646
Reaction score
561
Rating - 0%
0   0   0

Waterjockey

Well-Known Member
View Badges
Joined
Mar 30, 2016
Messages
646
Reaction score
561
Rating - 0%
0   0   0
And the authors state


Ie - the effect on the micro level will be overriden by the macro level

Sincerely Lasse

Thanks Lasse.
I'll post a link to the one of the studies I had in mind when I made my comments, regarding various food crops when I get my laptop back. As I said, the response depends on the class of plants. This field study which included mostly root crops (potatoes etc), showed a direct increase in harvestable food per acre, and significantly reduced irrigation requirements per incremental increases in Co2 availability. There were limits achieved in which the quality of the food (nutrient density) began to decrease at (off the top of my head) something like a 50% increase in CO2. For a number of crops, there wasn't necessarily a linear relationship between leaf area and root mass gain (i.e., able to produce more food without an equal amount in increased leaf area required because of increased respiration efficiency). The studies basically showed what we already know and used in the greenhouse industry for decades, does translate out into open air field crops...it's not exactly new research, but more along the lines of showing that we can apply greenhouse learnings to field crops. Part of my "increasing CO2 levels are not exclusively limited to negative effects, there are positive effects as well" mantra. :)
 

Lasse

10K Club member
View Badges
Joined
Mar 20, 2016
Messages
10,955
Reaction score
30,066
Location
Källarliden 14 D Bohus, Sweden
Rating - 0%
0   0   0
Yes it has but not the way you hope - even here its going warmer.

And a 25 % rise of CO2 since 1950 is no noice. The concentration of CO2 last 10 000 year shows a variation between 180 - 250 ppm until 150 years ago. Now its around 410 ppm - 1950 it was around 330.

The Berkerly group show a rise in temperature of 1.5 degree C during the last 150 years.

This is fact - hard fact

Sincerely Lasse
 

Waterjockey

Well-Known Member
View Badges
Joined
Mar 30, 2016
Messages
646
Reaction score
561
Rating - 0%
0   0   0
Yes it has but not the way you hope - even here its going warmer.

And a 25 % rise of CO2 since 1950 is no noice. The concentration of CO2 last 10 000 year shows a variation between 180 - 250 ppm until 150 years ago. Now its around 410 ppm - 1950 it was around 330.

The Berkerly group show a rise in temperature of 1.5 degree C during the last 150 years.

This is fact - hard fact

Sincerely Lasse

Hi Lasse,
To be clear, I do not dispute that atmospheric CO2 levels have been increasing, or that average global temperatures have increased over the past 150 years (or more), we are both in agreement with your statements above as factual and correct.
 

SPSREEFS

Active Member
View Badges
Joined
Apr 29, 2015
Messages
344
Reaction score
103
Location
La Mirada, Ca.
Rating - 0%
0   0   0
There are hundreds of square kilometers of dead reef from falling sea levels over thousands of years at the Barrier Reef. Proof that levels will rise and fall. Randys cut and pasted links are "needles in a haystack" obviously. If you knew that, I would think Global Warming theorists would be happy levels have risen .333 of one inch in some areas(so you say).
So if you built your house right on the ocean, and the .333 of one inch is a problem...well call your insurance company, go cry to moma, call your plumber, whatever makes you feel better. D0 n0t build on water(or too close to it), its not a good idea in the beginning.
Its so obvious to me that this is all about another way to shake the general population down for more taxes! Just another sign in the great morally corrupt civilizations we live in today.
People will lie through their teeth to keep their posh jobs. Not to have to go look elsewhere for work. Or risk being out of work.
Guys like Waterjockey and others seem to be much more well versed in this conversation then I and thank you for the great data, input and comments as well. Now that we have a different administration in office things will turn the other way. All EPA Board and top brass where fired. Hopefull that .333 rise will give us more corals. IF that rise is even correct. Was that a El Nino rise?

PS. Hey Randy, are you still holding to your word that we dont need strontium additions to reef tanks?
 

Randy Holmes-Farley

Reef Chemist
View Badges
Joined
Sep 5, 2014
Messages
68,319
Reaction score
64,818
Location
Arlington, Massachusetts, United States
Rating - 0%
0   0   0
And yes, look at the scale. The scale chosen by the NASA chart certainly seems to imply a rapidly rising level, when in what I consider the more relevant geological scale of perhaps hundreds of feet, it's more noise than signal.

Hundreds of feet? Really? That's what you'd need to see?
A rise of only a few feet will be a huge problem for coastal communities, and is clearly established by lots of differnt methods including local water gauges. That data says nothing about whether it is caused by man (although I think that evidence is also clear), but it is already happening and is already a problem.
 

Centerline

Valuable Member
View Badges
Joined
Sep 22, 2016
Messages
1,474
Reaction score
1,573
Location
St. Augustine, Florida
Rating - 0%
0   0   0
You won't. The "raw" data is/was held by a select small group who also happen to be firmly in the alarmism/activist camp. Several groups have been trying for years to gain access, via Freedom of Information (FOI requests), etc. Google raw data climate FOI or deleted, and apparently the "keepers of the raw data" deleted it. All you can access is the homogenized/adjusted data. Contrary to the typical open invite to critique as the foundation of science, the biggest noisemakers and creators of the gloom and doom climate change graphs categorically refuse to release the data the charts were apparently created from. It is not available for scientific critique/ examination. Ask Dr. Mann (of the famous hockey stick chart) for the data.....to date, he's even refused to release it in his Canadian SLAPP lawsuit against Dr. Ball, and could very well be found in contempt of court over it.

I have a hard time believing that the data that the very fate of humanity rests on, and to which literally trillions of dollars has been pledged to "fighting", had zero backup, and should be "protected" from public scrutiny and must be held in trust of a select few individuals in the world.

Some of the issues that have come up with blindly accepting the merged/homogenized/adjusted data are, for example, "zombie stations".....i.e, weather stations that no longer exist, but are incorporated into the data as "estimations" (when data is missing from a station for a period of time, as happens occasionally, the missing data is "estimated" and filled in, the estimated data is marked with an "E").......thus the rise of the zombie stations, nobody really caught for sometime they no longer exist and will never provide data again........relocation temperature adjustments. Sometimes weather stations get moved, and a temperature adjustment is applied to reflect the relocation.....except google maps shows many of the stations never actually moved, just their gps coordinates became more accurate...but the "adjustments" or biases are still applied........infill stations...where stations are far apart for example, the temperature between them is estimated and filled in...proxy stations as it were...they don't really exist but they are part of the adjusted data......whole parts of continents showing almost 2 degC rise that doesn't exist because of these errors, but are still in the data used to build the doom and gloom charts.
Sorry, I don't believe the keepers of the secret data are infallible, and the unwashed masses isn't entitled to the data their tax dollars paid for.
Well Man, I live in Florida and can show you spots all over the state where it is high and dry but a little digging reveals coral heads, they are everywhere and Florida has obviously been underwater before and will likely be underwater again. So the climate changes and if I could get my hands on that data it would be a very simple thing to start with the raw data and do a quick baseline study. The issue would be with the proxies themselves, attempting to quantify resolution specifically. That would require more data and lots of questions. I spent the last 3 or 4 days looking for a reliable source repository and dammed if I can find one. I'm just about ready to assign this as a project to a dev team I have that's sitting on their hands waiting for a client. Why quantifying the impact of climate change isn't a global open source project is beyond me. I will guarantee you that some of the predictive algorithms used in the financial industry would make short work of this - assuming we had the data of course. But all of this running around and freaking out on both sides of the issue is just silly. This is absolutely important and we absolutely need to have this discussion in an open and non biased way.
 

alton

Valuable Member
View Badges
Joined
Feb 8, 2016
Messages
1,875
Reaction score
3,228
Location
Zuehl, Texas
Rating - 0%
0   0   0
10 All-Time Hottest Weather Temperature Days in San Antonio History

1. September 5, 2000 - 111 degrees

2. September 4, 2000 - 109

3. August 19, 1986 - 108

4. August 20, 1909 - 107

4. June 15, 1998 - 107

6. August 9, 1953 - 106

6. August 11, 1936 - 106

6. August 13, 1962 - 106

6. July 2, 1894 - 106

6. July 19, 1989 - 106

6. July 26, 1954 - 106

6. July 27, 1954 - 106

6. June 21, 1936 – 106

The question is the San Antonio Weather station at the airport lying about its temperature? In 1978 the population was around 700,000. The airport where the recording station is located was surrounded by a two four lane roads, and two - two lane roads. Traffic was nothing. Today at almost 1,400,000 people and the roads are now two – eight lanes and two – four lanes with traffic coming to a stop, how does that not heat up the temp around the airport? In the late 60’s there was a commercial that came on before the news “It is 10 O’clock do you know where your children are?” Because no one was out on the street, there might be an occasional truck on the highway. Today no one sleeps, trucks never stop, and you will see just as many automobiles at 3 am as at 6am.

When I was a child I remember a winter morning of seven degrees and getting snow every few years. It has not snowed anything measurable in 32 years at my house.

Is the earth warming? Yes. Why? Too many people and we waste too much energy! Do I need to see another study? NO! What are we going to do about it? Nothing! As we enjoy FB, storing more data, driving our speed/ bass/ bay/ ski boat/ jet ski, and so many other toys we will continue to waste energy. When I see a plant that makes solar panels run exclusively off of those panels they produce, I will believe that solar is the future. On the other hand I do love wind power.

But unless we are want to go back in time when everyone had a 30 amp meter socket with 8 light bulbs, a plug for a freezer and one for a fridge, one TV in the living room (shared power with freezer), drive your auto less than 5,000 miles a year, stay home on weekends, lower our population, and the big one No AC, nothing will change. So continue on with the argument about global warming because nothing will change.

Oh yea one last thing please do not mention computer models, meteorologist use them all the time and they are the only people who can get it wrong most of the time and still have a job!

Okay I am done, let me go sit back down and watch my fish in my 180 gallon reef tank and a movie from direct tv on my 50” big screen in my living room with the AC set at 75.

By the way I love R2R!
 

Randy Holmes-Farley

Reef Chemist
View Badges
Joined
Sep 5, 2014
Messages
68,319
Reaction score
64,818
Location
Arlington, Massachusetts, United States
Rating - 0%
0   0   0
PS. Hey Randy, are you still holding to your word that we dont need strontium additions to reef tanks?

That is certainly my opinion based on a number of factors.

Do you think otherwise? Why?

There are a very few organisms that specifically need strontium to make certain types of structures, but normal coral skeletons is not one of them. Few if any reefers keep those that need strontium.
 

SPSREEFS

Active Member
View Badges
Joined
Apr 29, 2015
Messages
344
Reaction score
103
Location
La Mirada, Ca.
Rating - 0%
0   0   0
10 All-Time Hottest Weather Temperature Days in San Antonio History

1. September 5, 2000 - 111 degrees

2. September 4, 2000 - 109

3. August 19, 1986 - 108

4. August 20, 1909 - 107

4. June 15, 1998 - 107

6. August 9, 1953 - 106

6. August 11, 1936 - 106

6. August 13, 1962 - 106

6. July 2, 1894 - 106

6. July 19, 1989 - 106

6. July 26, 1954 - 106

6. July 27, 1954 - 106

6. June 21, 1936 – 106

The question is the San Antonio Weather station at the airport lying about its temperature? In 1978 the population was around 700,000. The airport where the recording station is located was surrounded by a two four lane roads, and two - two lane roads. Traffic was nothing. Today at almost 1,400,000 people and the roads are now two – eight lanes and two – four lanes with traffic coming to a stop, how does that not heat up the temp around the airport? In the late 60’s there was a commercial that came on before the news “It is 10 O’clock do you know where your children are?” Because no one was out on the street, there might be an occasional truck on the highway. Today no one sleeps, trucks never stop, and you will see just as many automobiles at 3 am as at 6am.

When I was a child I remember a winter morning of seven degrees and getting snow every few years. It has not snowed anything measurable in 32 years at my house.

Is the earth warming? Yes. Why? Too many people and we waste too much energy! Do I need to see another study? NO! What are we going to do about it? Nothing! As we enjoy FB, storing more data, driving our speed/ bass/ bay/ ski boat/ jet ski, and so many other toys we will continue to waste energy. When I see a plant that makes solar panels run exclusively off of those panels they produce, I will believe that solar is the future. On the other hand I do love wind power.

But unless we are want to go back in time when everyone had a 30 amp meter socket with 8 light bulbs, a plug for a freezer and one for a fridge, one TV in the living room (shared power with freezer), drive your auto less than 5,000 miles a year, stay home on weekends, lower our population, and the big one No AC, nothing will change. So continue on with the argument about global warming because nothing will change.

Oh yea one last thing please do not mention computer models, meteorologist use them all the time and they are the only people who can get it wrong most of the time and still have a job!

Okay I am done, let me go sit back down and watch my fish in my 180 gallon reef tank and a movie from direct tv on my 50” big screen in my living room with the AC set at 75.

By the way I love R2R!
Alton, your irresponsible and ruining our environment.....lol
 
Status
Not open for further replies.
Back
Top