Navigation
Install the app
How to install the app on iOS
Follow along with the video below to see how to install our site as a web app on your home screen.
Note: This feature may not be available in some browsers.
More options
You are using an out of date browser. It may not display this or other websites correctly.
You should upgrade or use an alternative browser.
You should upgrade or use an alternative browser.
Guide: Telemetry server
- Thread starter Ranjib
- Start date
- Tagged users None
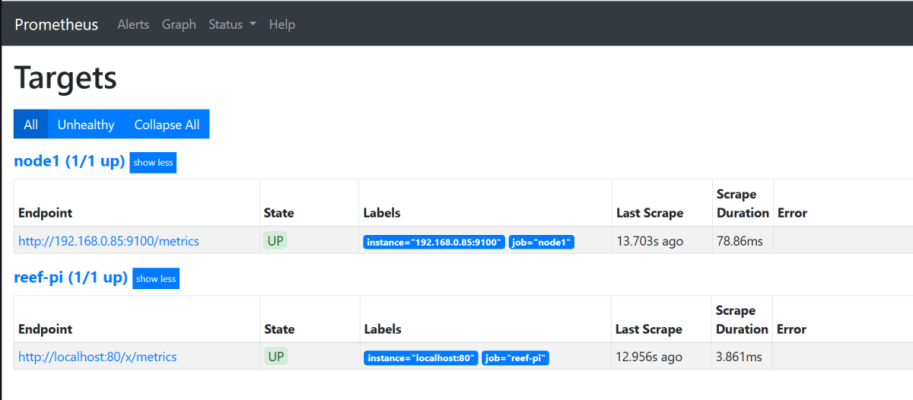
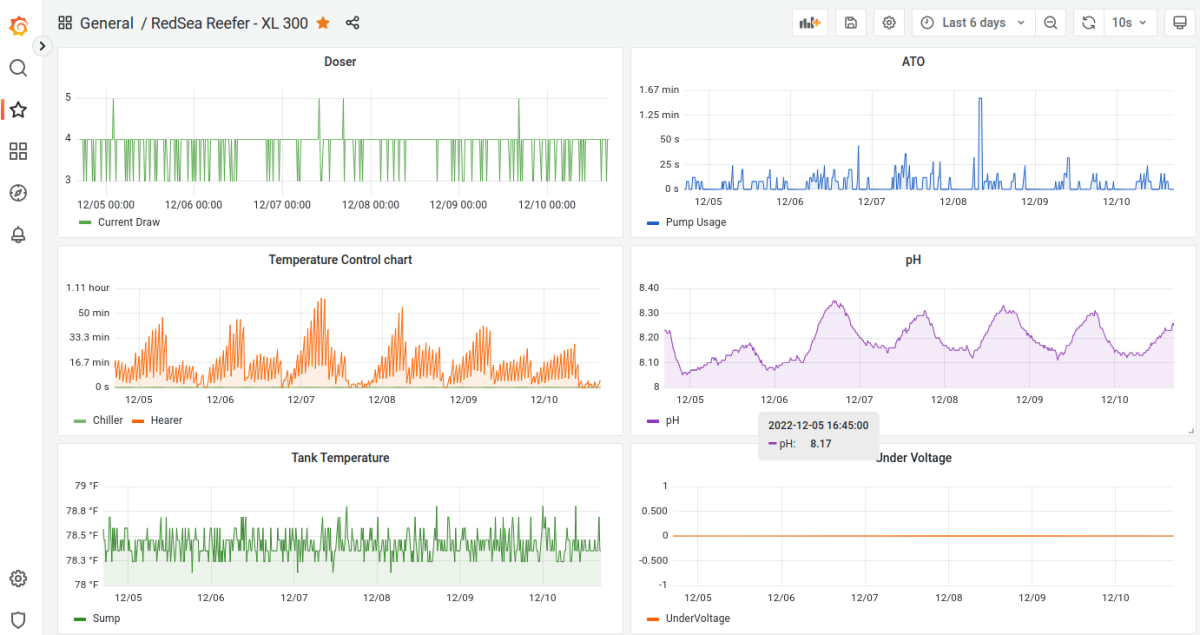
Hi all, could someon of you provide a hint how to proceed with reef-pi prometheus and charts under Grafana (best via cloud).My actual status is: I have reef-pi controller with reef-pi installed there, to my desktop (Windows 10) I have installed Prometheus and Node Exporter (see 1st picture).So far I am able to see via cloud status of my ree-pi controller in Grafana (see picture 2 and 3).I would like to see in charts aquarium metrics from reef-pi controller (like temperature etc..). I am now stucked and cannot move forward. My problem is how to force Grafana to take data from http://localhost:80/x/metrics and not from http://192.168.0.85:9100/metrics.Any help would be greatly appreciated.May be is there an easier solution (without cloud)?Thanks in advance.Petr
Attachments
try:Hi all, could someon of you provide a hint how to proceed with reef-pi prometheus and charts under Grafana (best via cloud).My actual status is: I have reef-pi controller with reef-pi installed there, to my desktop (Windows 10) I have installed Prometheus and Node Exporter (see 1st picture).So far I am able to see via cloud status of my ree-pi controller in Grafana (see picture 2 and 3).I would like to see in charts aquarium metrics from reef-pi controller (like temperature etc..). I am now stucked and cannot move forward. My problem is how to force Grafana to take data from http://localhost:80/x/metrics and not from http://192.168.0.85:9100/metrics.Any help would be greatly appreciated.May be is there an easier solution (without cloud)?Thanks in advance.Petr
In Grafana , click on the Configuration/Data Sources
Add data source
Choose Prometheus
In the URL field, enter "http://localhost:80/x/metrics".
In the HTTP section uncheck Basic Auth and With Credentials.
Click on Save & Test to test the connection.
This guide will walk through the installation and configuration of a long term, robust and featureful telemetry stack. With this you can observe your reef tank ato usage, long term temperature trends, build custom dashboard and more. To do this we install a trifecta of three awesome opensource software, namely: prometheus, grafana and node exporter. It will be extra awesome If you have an existing reef-pi installation that you can use that to integrate with this telemetry server. But this is not necessary, and we'll cover a minimal all contained in one mini pc, including reef-pi setup.
Background
reef-pi 6.0 is just out with esp32 integration and x86 builds, this means we can now run reef-pi on non pi computers and offload the hadware interfacing to esp32 and raspberry pi pico like microcontroller. With the ongoaing shortage of chip supply and consequently raspberry pi 3/4/zeros, reef-pi 6.0 provides an alternative to raspberry pi based installation. But tangential to this(bypassing supply chain issue) running on x86 systems mean reef-pi controller can now have significantly more computing power. There are multitude of functionalities in reef-pi that are purpose built to work on low computing power environment (like metric retention, dashboard etc) and with low dependencies. While this gives a slim working controller runnable to raspberry pi, it deprives whole bunch of awesomeness opensource can offer. Running on x86, with all the firepower available now removes that limitation. In this guide i want to walk through one such awesome capabilities "telemetry" that was very hard to setup on raspberry pi, but can be easily run on mini pc, laptop or desktop based setup (x86 /intel systems).
Hardware
We'll start with installing reef-pi in a common non raspberry pi computer (x86). Any laptop, PC, mini-pc should do.
For this guide i am using a cheaper intel celeron based mini pc with ssd (A genuine, 250$+ Intel NUC will be awesome).
At minimum, consider a somewhat beefy, 2-4 core (2.4GHz+celeron), 8 GB ram, 128Gb SSD (no emmc ) computer. It is expected to be capable of running a full dekstop environment, with peripherals attached, (often powered through it) .
As of the time of writing this guide such systems cost aroun 120-170$ USD. I am experimenting with a amd a90 based 87$ system, but its not well tested yet for me to vouch for it,
I am not covering how to install linux on mini pc, there are ample tutorials and youtube videos on this topic, please refer to one of those. I am also assuming users are familiar with terminal or command line. You will be using it to install and configure a few things.
Software Installation & configuration
- Prometheus, at the heart of this stack is the metrics storage software. The metrics emitted from reef-pi (such as temperature, ato usage, ph ) are scraped by prometheus and stored for longer duration. Anything can programmaticaly query obtain those metrics. Prometheus is a cloud native metric store that is lingua franca for all things metrics storage in web technology, you are riding on the shoulder of a giant. Hence we start with prometheus installation.
Download prometheus from github release page or their homepage.
Decompress to obtain the prometheus binary and move it in /usr/bin directoryCode:wget -c https://github.com/prometheus/prometheus/releases/download/v2.40.4/prometheus-2.40.4.linux-amd64.tar.gz
Code:tar -zxvf prometheus-2.40.4.linux-amd64.tar.gz sudo mv prometheus-2.40.4.linux-amd64/prometheus /usr/bin/
Copying over a starter example configuration file for prometheus
Code:sudo cp prometheus-2.40.6.linux-amd64/prometheus.yml /etc/prometheus.yml
Create a systemd unit file to be able to run and supervise promethus on this system across reboots.
Code:[Unit] Description=prometheus [Service] TimeoutStartSec=0 ExecStart=/usr/bin/prometheus --config.file=/etc/prometheus.yml --storage.tsdb.path=/var/lib/prometheus/ --storage.tsdb.retention.time=5y --web.listen-address=:8888 [Install] WantedBy=multi-user.target
Next lets ask systemd to read the new unit file (at /etc/systemd/system/prometheus.service) and start prometheus
Code:systemctl daemon-reload sudo systemctl start prometheus.service sudo systemctl enable prometheus.service sudo systemctl status prometheus.service
Once prometheus is up and running we can move on to installing grafana, it is a software
- Grafana - the dashboard software. installation grafana by following their official installation guide. and integration with prometheus. Once grafana is installed configure prometheus as a datasource in grafana. With this now you can visualize and see any metric from prometheus in grafana.
- This is an option step. If you have an existing reef-pi (running on pi ) then skip this. If you are using this system itself as reef-pi controller (with esp32) then proceed with installing reef-pi. start with downloading reef-pi package for x86 systems
Code:wget -c https://github.com/reef-pi/reef-pi/releases/download/6.0/reef-pi-6.0-x86.deb
followed by installing
Code:sudo dpkg -i reef-pi-6.0-x86.deb
- Next configure reef-pi to emit prometheus metric by enabling the integration under Configuration->Settings
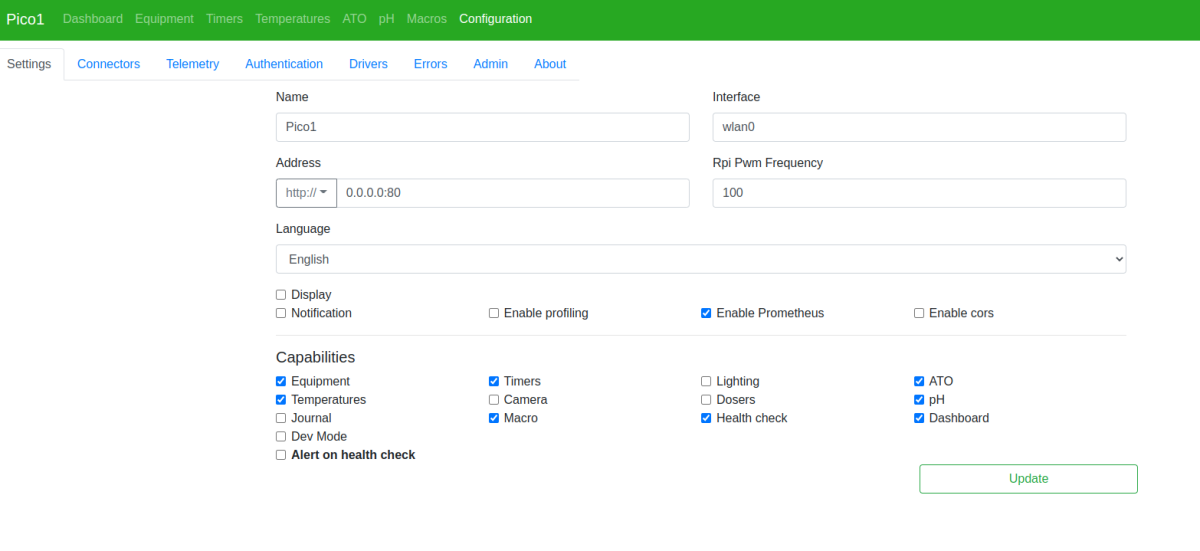
and reload reef-pi (Configuration -> Admin->Reload)
- Next configure prometheus to scrape reef-pi metrics.
Open and edit the "/etc/prometheus.yaml" file and add a job name "pico1" with appropriate ip and port. specify the "metrics_path" option as shown and set it to "/x/metrics". reef-pi provide prometheus metrics at "http://<reef-pi-ip>/x/metrics" path. you can type it in your browser (replace with you reef-pi controller ip) to get a glimpse of the raw metrics.
Code:global: scrape_interval: 15s evaluation_interval: 15s scrape_configs: - job_name: "prometheus" static_configs: - targets: ["localhost:9090"] - job_name: "reef-pi" metrics_path: '/x/metrics' static_configs: - targets: ["localhost:80"]
- Lets create a dashboards with reef-pi metrics
- Optionally: Node exporter - host metrics gathering software
"/etc/systemd/system/node_exporter.service"
Code:[Unit] Description=Prometheus Node Exporter Documentation=https://github.com/prometheus/node_exporter After=network-online.target [Service] User=root ExecStart=/usr/bin/node_exporter Restart=on-failure RestartSec=5 [Install] WantedBy=multi-user.target
Start and enable node exporter as a service.
Code:sudo systemctl daemon-reload sudo systemctl start node_exporter.service sudo systemctl status node_exporter.service sudo systemctl enable node_exporter.service
Configure prometheus to scrape from node exporter , for host metrics by editing the /etc/prometheus.yaml file.
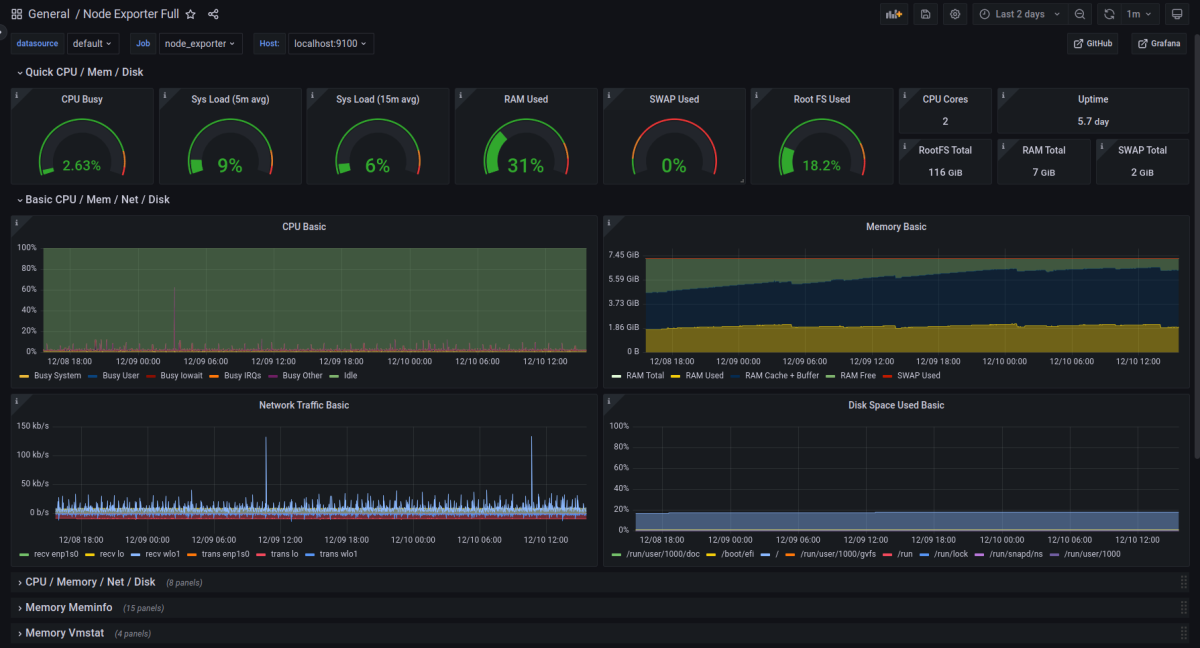
Restart prometheus. Go to your grafana dashboard and import the node exporter community dashboard template. Specify prometheus data source that you have configured with grafana in previous step.
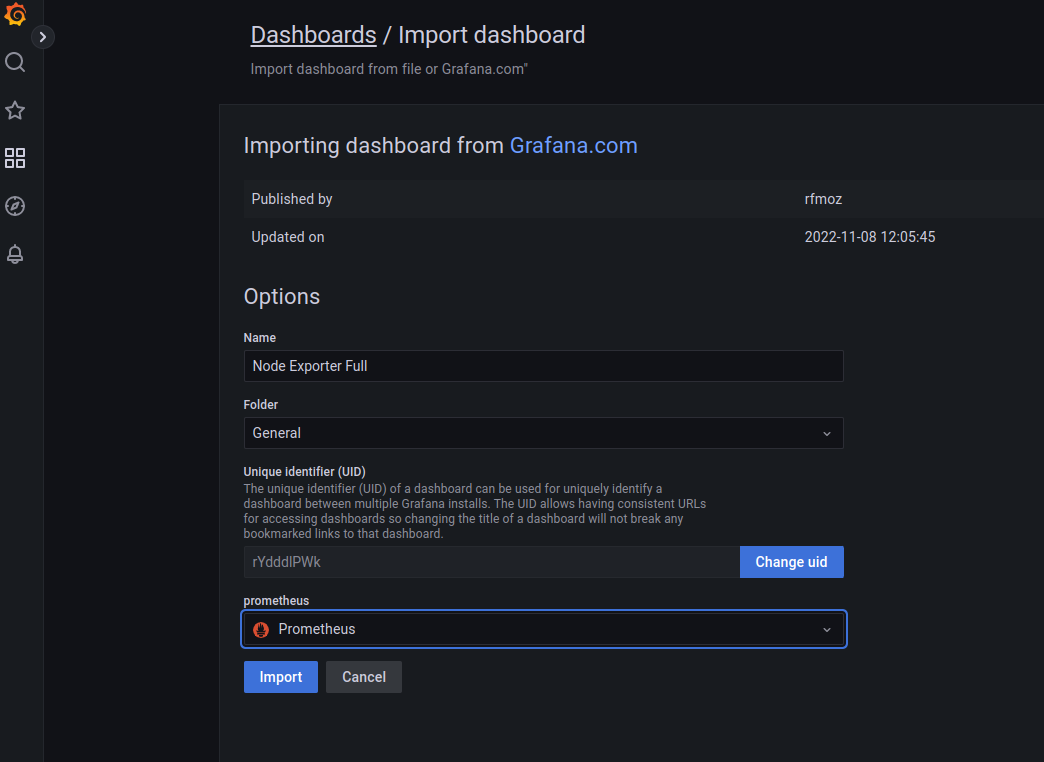
Once imported, you should be able to see the localhost metrics within next 10 seconds. Here is how mine looks
Now off to building a reef-pi specific dashboard. The key thing to remeber is this, that
a) reef-pi emits metrics that can be observed in /x/metrics path in the app to get their name,
b) then these metrics are then scraped and stored by prometheus, and then
c) we configure the dashboard in grafan to get those metrics from prometheus and display it in any fancy way our heart desire.
Since our current reef-pi does not have any sensor attached we'll use a controller health metrics , system load to build a graph. the emitted metrics look like this (from /x/metics page)
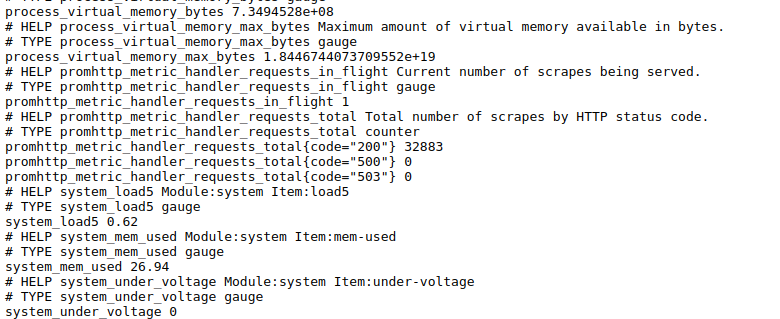
Which means prometheus will scrape and store these metrics with exactly those names under the job "reef-pi" (because of the configuration in prometheus.yaml file). And hence we can use that in grafana, by creating a new dashboard -> and then a new panel under the dashboard, followed by selecting the system load metric
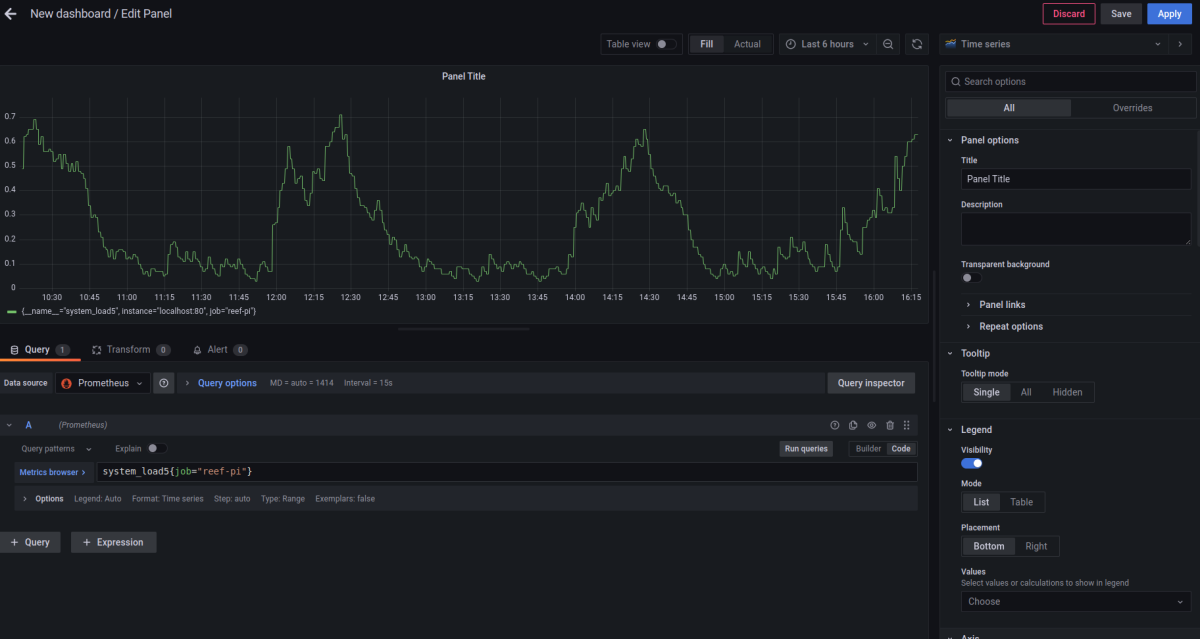
Now, because we dont have anything for controlling this setup in itself does not have any data to show. But in reality a controller will have many sesnors, controlling equipment attached to it. And to build a comprehensive dashboard we have to know the names of the corresponding metrics. reef-pi follows certain convention for converting the data in controller to metric names,. For example the temperature module emits three metric "<name>_reading" (current temperature), <name>_heater (heater usage of that hour) and <name>_cooler (chiller usage of that hour). "name" here represent the name of the temperature controller. The screenshot below shows my pico 1 controller where the temperature probe is named as "Tank"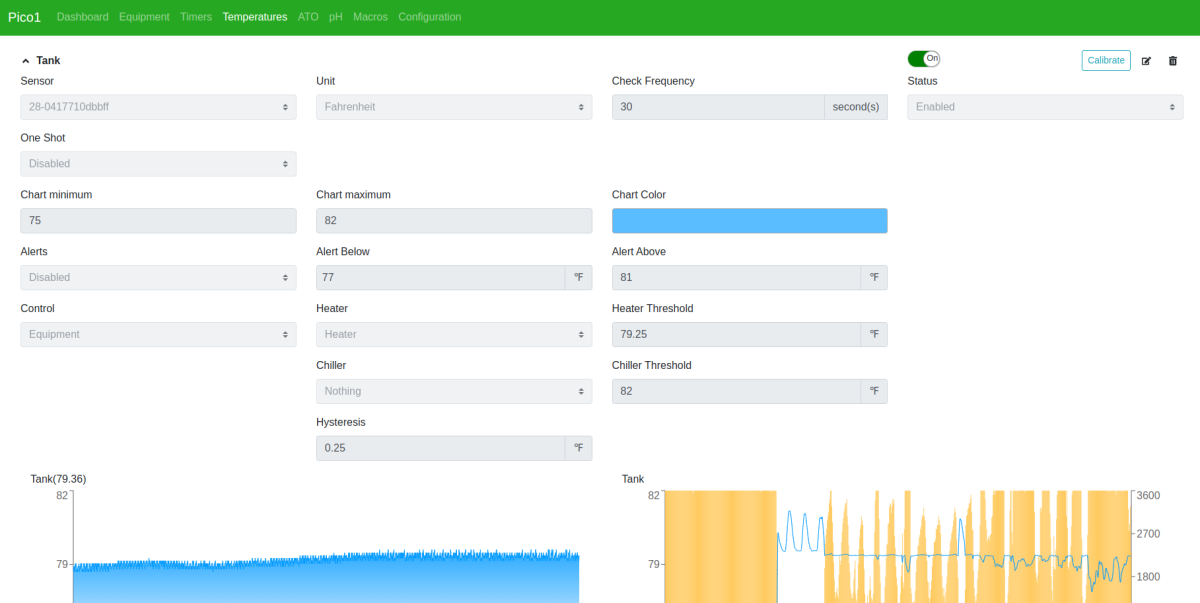
corresponding reef-pi metrics page (/x/metrics)
now, i can configure prometheus to scrape my pico1 controller metrics and then use those metrics to build a temperature graph.
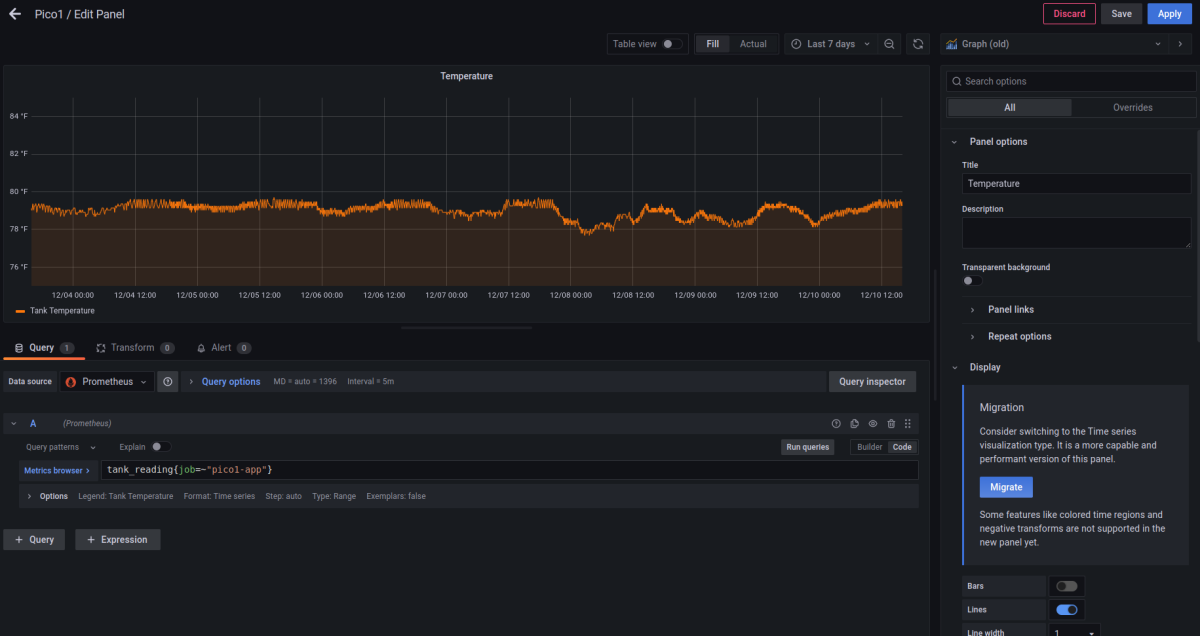
Here is more elaborate my pico tank metrics, notice there is ato metyric, health metri and more.,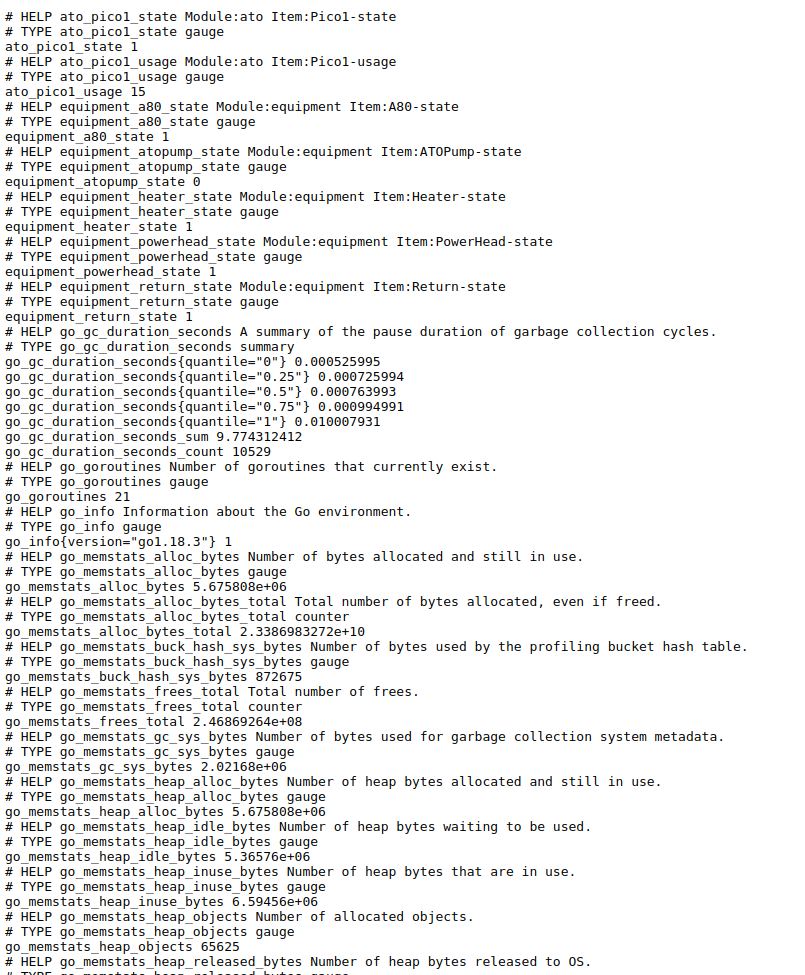
and powered by those, i have a comprehensive dashboard for my pico1 tank that provide, ato, temperature and system health status
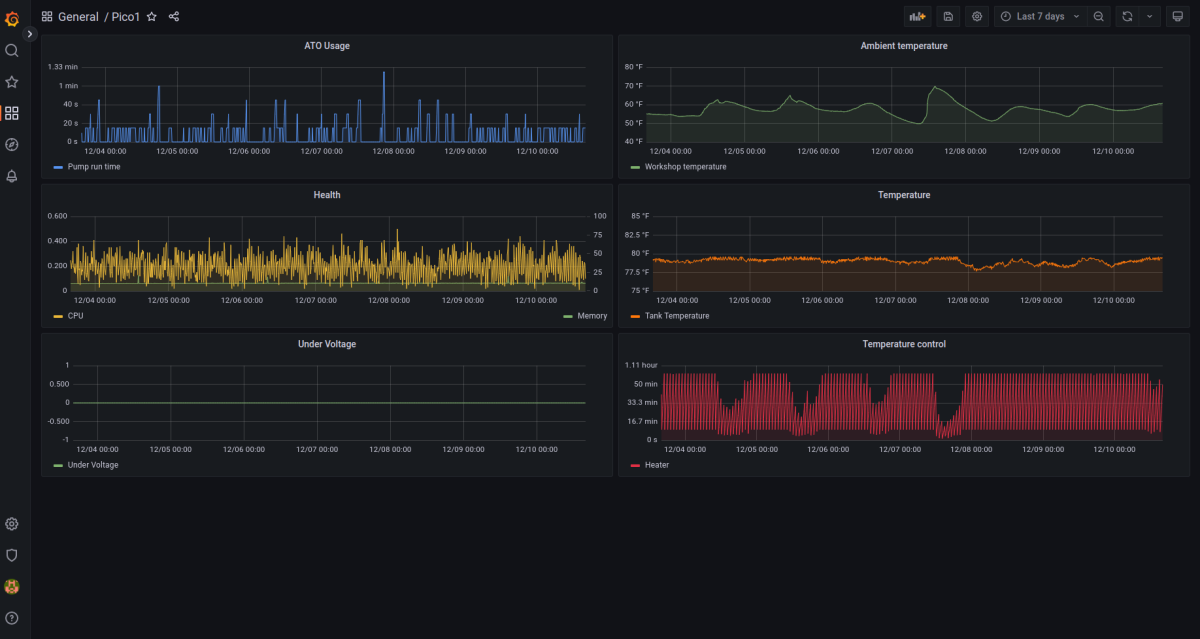
I have also added ambient temperature (my workshop where the tank is located) from another sensor in this dashboard.
In the beginning of the guide we talked about durability and robustness of this setup. Now we can actualize those capabilities. We can retain data for years (my oldest setup has 4+ years of telemetry data now) and from a number of different controllers in one place. Here is an example of a dashboard that covers all my 7 setups (1 reefer 300xl, 1 biocube 29, and 5 picos of different configuration) all in one place
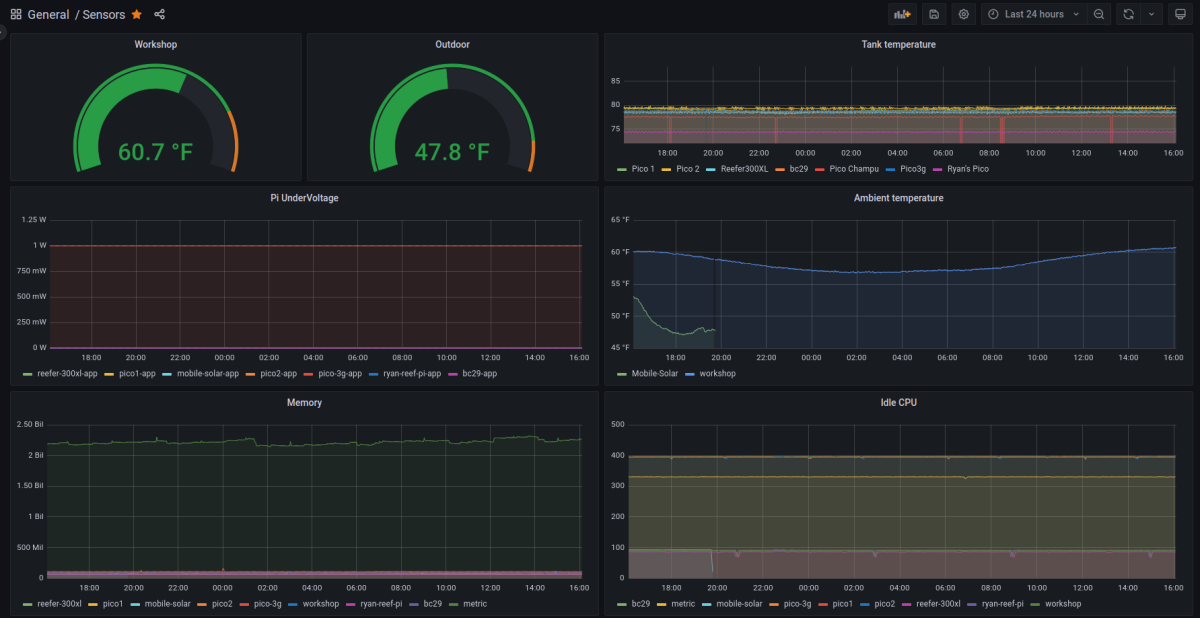
Sky is the limit from here. You are now running the same tech that powers some of the largest and world renowned tech organizations. Its is been vetted by their use and it is here by the larger opensource communities hard work. You are riding one the shoulder of giants, this setup can work for multiple dozens of controller. This same stack could be run on beefire rack mounted servers to support thousands of controller and more.
This completes the telemetry guide for reef-pi 6.0 with x86 setup. Please let me know if you have any feedback and I will try my best to incorporate it as and when i receive it.
As a data hoarder you did a great job. Data is beautiful
Although I myself am guilty if you have time and are inclined putting this into GitHub may also help once you have a good set of instructions and/or documentation. I am using Grafana, influx, and telegraph for a similar experience. I've not used node exporter. Will need to see how it compares.
Great job - and keep up the great work.
Grafana does not store data. Metrics from reef-pi is scraped and stored by Prometheus and grafana is configured to get data from Prometheus .Hi all, could someon of you provide a hint how to proceed with reef-pi prometheus and charts under Grafana (best via cloud).My actual status is: I have reef-pi controller with reef-pi installed there, to my desktop (Windows 10) I have installed Prometheus and Node Exporter (see 1st picture).So far I am able to see via cloud status of my ree-pi controller in Grafana (see picture 2 and 3).I would like to see in charts aquarium metrics from reef-pi controller (like temperature etc..). I am now stucked and cannot move forward. My problem is how to force Grafana to take data from http://localhost:80/x/metrics and not from http://192.168.0.85:9100/metrics.Any help would be greatly appreciated.May be is there an easier solution (without cloud)?Thanks in advance.Petr
All of a sudden a few weeks ago I started seeing these errors "DatasourceNoData" and it has continued to happen several times a day. Not sure what has changed but I can see on my graphs it's not able to pull data. Just not sure where to start looking first or what to adjust, @Ranjib have any thoughts. Here is my prometheus chart and you can clearly see the issue, reef-pi instance has not changed and appears to be running happily so confused as to what is causing this, thanks.
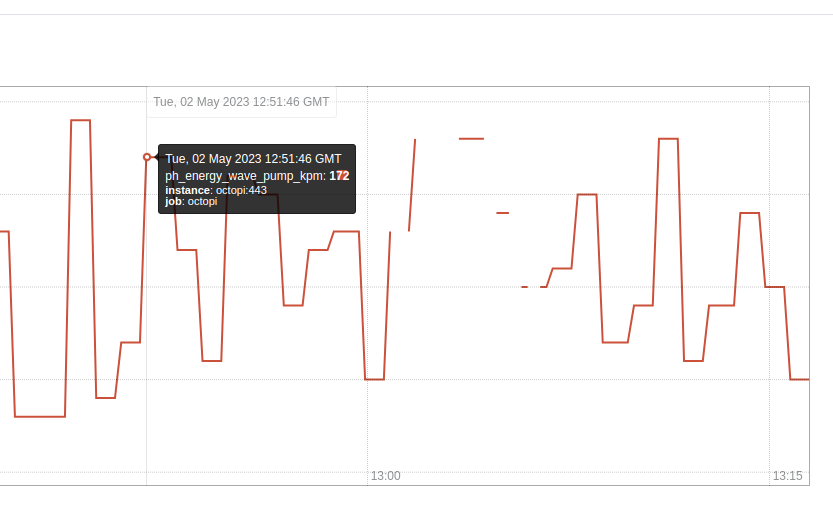
Well I do see this in the logs, so this explains some of it although not why its happening, I have some devices plugged in a Kasa strip and trying to get energy output and seems to be timing out:
May 10 23:41:47 octopi reef-pi[519]: 2023/05/10 23:41:47 ph sub-system: ERROR: Failed to read probe: Energy Return Pump . Error: dial tcp 10.99.99.16:9999: i/o timeout
May 10 23:41:48 octopi reef-pi[519]: 2023/05/10 23:41:48 ph sub-system: ERROR: Failed to read probe: Energy Wave Pump KPM . Error: dial tcp 10.99.99.16:9999: i/o timeout
May 10 23:42:47 octopi reef-pi[519]: 2023/05/10 23:42:47 ph sub-system: ERROR: Failed to read probe: Energy Return Pump . Error: dial tcp 10.99.99.16:9999: i/o timeout
May 10 23:42:48 octopi reef-pi[519]: 2023/05/10 23:42:48 ph sub-system: ERROR: Failed to read probe: Energy Wave Pump KPM . Error: dial tcp 10.99.99.16:9999: i/o timeout
May 11 02:36:47 octopi reef-pi[519]: 2023/05/11 02:36:47 ph sub-system: ERROR: Failed to read probe: Energy Return Pump . Error: dial tcp 10.99.99.16:9999: i/o timeout
May 11 02:36:48 octopi reef-pi[519]: 2023/05/11 02:36:48 ph sub-system: ERROR: Failed to read probe: Energy Wave Pump KPM . Error: dial tcp 10.99.99.16:9999: i/o timeout
May 11 02:37:47 octopi reef-pi[519]: 2023/05/11 02:37:47 ph sub-system: ERROR: Failed to read probe: Energy Return Pump . Error: dial tcp 10.99.99.16:9999: i/o timeout
May 11 02:37:48 octopi reef-pi[519]: 2023/05/11 02:37:48 ph sub-system: ERROR: Failed to read probe: Energy Wave Pump KPM . Error: dial tcp 10.99.99.16:9999: i/o timeout
May 11 02:39:47 octopi reef-pi[519]: 2023/05/11 02:39:47 ph sub-system: ERROR: Failed to read probe: Energy Return Pump . Error: dial tcp 10.99.99.16:9999: i/o timeout
May 11 02:39:48 octopi reef-pi[519]: 2023/05/11 02:39:48 ph sub-system: ERROR: Failed to read probe: Energy Wave Pump KPM . Error: dial tcp 10.99.99.16:9999: i/o timeout
May 11 05:34:47 octopi reef-pi[519]: 2023/05/11 05:34:47 ph sub-system: ERROR: Failed to read probe: Energy Return Pump . Error: dial tcp 10.99.99.16:9999: i/o timeout
May 11 05:34:48 octopi reef-pi[519]: 2023/05/11 05:34:48 ph sub-system: ERROR: Failed to read probe: Energy Wave Pump KPM . Error: dial tcp 10.99.99.16:9999: i/o timeout
May 11 05:35:47 octopi reef-pi[519]: 2023/05/11 05:35:47 ph sub-system: ERROR: Failed to read probe: Energy Return Pump . Error: dial tcp 10.99.99.16:9999: i/o timeout
May 11 05:35:48 octopi reef-pi[519]: 2023/05/11 05:35:48 ph sub-system: ERROR: Failed to read probe: Energy Wave Pump KPM . Error: dial tcp 10.99.99.16:9999: i/o timeout
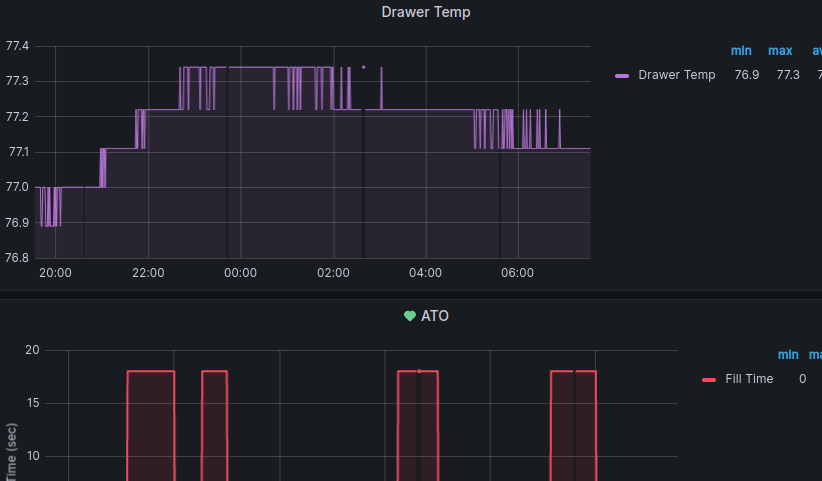
Although I see the issue for other charts also including temperature readings etc which is different, here are the gaps for temp readings and ato...so maybe something is going on with the pi and network...
Last edited:
Just wondering, but I'm still running my reef-pi on a Pi2B+ which is working fine, just very sluggish when operating on the Pi Desktop. It's for a tank in a secondary science classroom. Is this telemetry achievable / a good idea on the Pi2? It would be great for my students (read: myself mainly) to have a reliable set of data to analyse. Or would it better to create an Adafruit.IO dashboard that students can access.
Last edited:
So you could enable the stat portion on your rpi 2b+ but you would want to have another device to run grafana etc...it can be another rpi or something else but I would not run grafana and the other software all on the same device...just my opinion.Just wondering, but I'm still running my reef-pi on a Pi2B+ which is working fine, just very sluggish when operating on the Pi Desktop. It's for a tank in a secondary science classroom. Is this telemetry achievable / a good idea on the Pi2? It would be great for my students (read: myself mainly) to have a reliable set of data to analyse. Or would it better to create an Adafruit.IO dashboard that students can access.
The story so far...
I have Reef-pi running, set up on a Rpi3B. I have the software auto-starting AFTER the network comes up, and is now binding to HTTPS automagically. I've got the sensors and outputs all working and doing reef-pi things as they should.
Okay, the next chapter in my adventure with reef-pi... Telemetry.
In this same network, I have two more servers (both VM's). One is running Prometheus (via docker container managed via Portainer), and another is running Grafana. The guide in this thread is based on running Reef-pi on a x86 environment and is a vertical stack on a single host, so I've had to deviate from the published directions. And it's bitten me in the @#$%.
(IP's in this post changed for security)
So, I have set up Reef-pi and Node_Exporter on the Rpi (192.168.1.2). The guide doesn't provide installation guidance for Node_Exporter, so I had to fart around a little but now have it installed and running:
If I browse to http://192.168.1.2:9100/metrics - I can see data (Exert):
On a second server, I have Prometheus up on running in a container. I've modified the /etc/prometheus/prometheus.yml file to add the reef-pi job. I had to modify the 'metrics path' as there was none published at /x/metrics:
Finally, I have a third server (192.168.1.4) with Grafana installed. I've created a Prometheus data source, provided the http://192.168.1.3:9090 URL and set it to server mode. Hitting "Save & Test", it tells me "Data source is working". Finally, I have the Node_Exporter dashboard installed (ID: 1860).
At this point, I SHOULD, I would think, be able to open the dashboard, select my data source, job, and host, and see data. I can't. When I open the dashboard, I get three errors:
"{Templating} Failed to upgrade legacy queries e.replace is not a function", "{Templating [job]} Error updating options: e.replace is not a function", and "{Templating [node]} Error updating options: e.replace is not a function". The Datasource drop-down populates, but the Job and Host drop-downs do not.
Any help is appreciated.
I have Reef-pi running, set up on a Rpi3B. I have the software auto-starting AFTER the network comes up, and is now binding to HTTPS automagically. I've got the sensors and outputs all working and doing reef-pi things as they should.
Okay, the next chapter in my adventure with reef-pi... Telemetry.
In this same network, I have two more servers (both VM's). One is running Prometheus (via docker container managed via Portainer), and another is running Grafana. The guide in this thread is based on running Reef-pi on a x86 environment and is a vertical stack on a single host, so I've had to deviate from the published directions. And it's bitten me in the @#$%.
(IP's in this post changed for security)
So, I have set up Reef-pi and Node_Exporter on the Rpi (192.168.1.2). The guide doesn't provide installation guidance for Node_Exporter, so I had to fart around a little but now have it installed and running:
[FONT=courier new]# node_exporter --version
node_exporter, version 1.5.0 (branch: HEAD, revision: 1b48970ffcf5630534fb00bb0687d73c66d1c959)
build user: root@6e7732a7b81b
build date: 20221129-18:59:41
go version: go1.19.3
platform: linux/arm64[/FONT]
If I browse to http://192.168.1.2:9100/metrics - I can see data (Exert):
# HELP node_scrape_collector_duration_seconds node_exporter: Duration of a collector scrape.
# TYPE node_scrape_collector_duration_seconds gauge
node_scrape_collector_duration_seconds{collector="arp"} 0.000299374
node_scrape_collector_duration_seconds{collector="bcache"} 5.5989e-05
node_scrape_collector_duration_seconds{collector="bonding"} 7.9896e-05
node_scrape_collector_duration_seconds{collector="btrfs"} 0.000721872
node_scrape_collector_duration_seconds{collector="conntrack"} 8.8645e-05
node_scrape_collector_duration_seconds{collector="cpu"} 0.089248409
{there's more but this post was gonna be long enough}
On a second server, I have Prometheus up on running in a container. I've modified the /etc/prometheus/prometheus.yml file to add the reef-pi job. I had to modify the 'metrics path' as there was none published at /x/metrics:
global:
scrape_interval: 15s # By default, scrape targets every 15 seconds.
# Attach these labels to any time series or alerts when communicating with
# external systems (federation, remote storage, Alertmanager).
external_labels:
monitor: 'codelab-monitor'
# A scrape configuration containing exactly one endpoint to scrape:
# Here it's Prometheus itself.
scrape_configs:
# The job name is added as a label `job=<job_name>` to any timeseries scraped from this config.
- job_name: 'prometheus'
# Override the global default and scrape targets from this job every 5 seconds.
scrape_interval: 5s
static_configs:
- targets: ['localhost:9090']
- job_name: 'pihole-1'
static_configs:
- targets: ['x.x.x.x:99999']
- job_name: 'pihole-2'
static_configs:
- targets: ['x.x.x.x:99999']
- job_name: 'reef-pi'
metrics_path: '/metrics'
static_configs:
- targets: ['192.168.1.2:9100']
Finally, I have a third server (192.168.1.4) with Grafana installed. I've created a Prometheus data source, provided the http://192.168.1.3:9090 URL and set it to server mode. Hitting "Save & Test", it tells me "Data source is working". Finally, I have the Node_Exporter dashboard installed (ID: 1860).
At this point, I SHOULD, I would think, be able to open the dashboard, select my data source, job, and host, and see data. I can't. When I open the dashboard, I get three errors:
"{Templating} Failed to upgrade legacy queries e.replace is not a function", "{Templating [job]} Error updating options: e.replace is not a function", and "{Templating [node]} Error updating options: e.replace is not a function". The Datasource drop-down populates, but the Job and Host drop-downs do not.
Any help is appreciated.
- Joined
- Dec 2, 2019
- Messages
- 500
- Reaction score
- 510
Thank you @Ranjib !
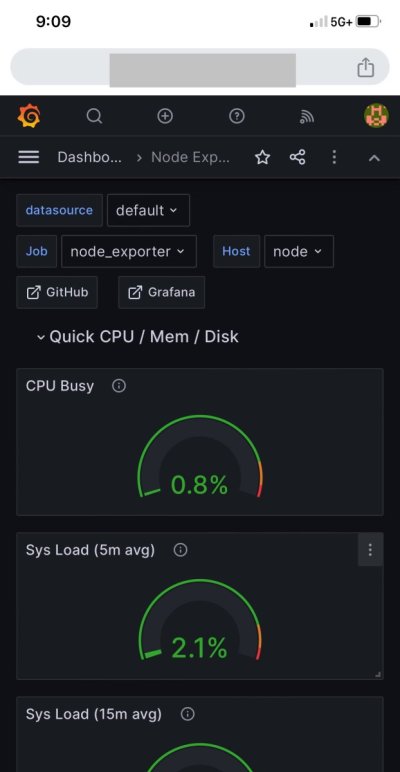
For now with small data history appears to be working great on Pi4. I installed Apache to host my Pi4’s Grafana and after some network configuring can now remotely access Reef-Pi metrics without Adafruit, nice!
For now with small data history appears to be working great on Pi4. I installed Apache to host my Pi4’s Grafana and after some network configuring can now remotely access Reef-Pi metrics without Adafruit, nice!

Looks like it can be done.. mine was up on an unbuntu box. Need to get it back up and running.


..im thinking about trying to use windows.. as if I go with ubuntu again it will be the 3rd time I have reinstall it.. my problem is how locked down ubuntu is.. I literally can not move files or edit files to/in certain parts of the file system. Its like I am not the admin. I have tired both times to change myself to root but it doesn't seem to work...
..im thinking about trying to use windows.. as if I go with ubuntu again it will be the 3rd time I have reinstall it.. my problem is how locked down ubuntu is.. I literally can not move files or edit files to/in certain parts of the file system. Its like I am not the admin. I have tired both times to change myself to root but it doesn't seem to work...
Sounds like user error. Sudo should give you access to do anything, including deleting critical system files hosing the system.
- Joined
- Dec 2, 2019
- Messages
- 500
- Reaction score
- 510
Open a terminal and run the command “sudo pcmanfm”. Should give you super user permissions to move files around - be careful thoughmeh, true.. but im also using the desktop version and not the terminal.
I'll have to try that... I was on the 15page of Google looking for somethingOpen a terminal and run the command “sudo pcmanfm”. Should give you super user permissions to move files around - be careful though
You can do this in windows with cygwin, it is a linux emulator for windows. If you go crazy you can even install docker desktop and along with cygwin you can run linux containers on your pc. Easy to start stop, duplicate etc. That would give you a 'windows' experience with Linux framework.
So I have reinstalled Ubuntu and believe I successfully got to the point where I need to use Prometheus as a data source. .. what would be some of the reasons that I would get the error "Connection: refused - There was an error returned querying the Prometheus API"
Prometheus is active and the .ym file is as follows
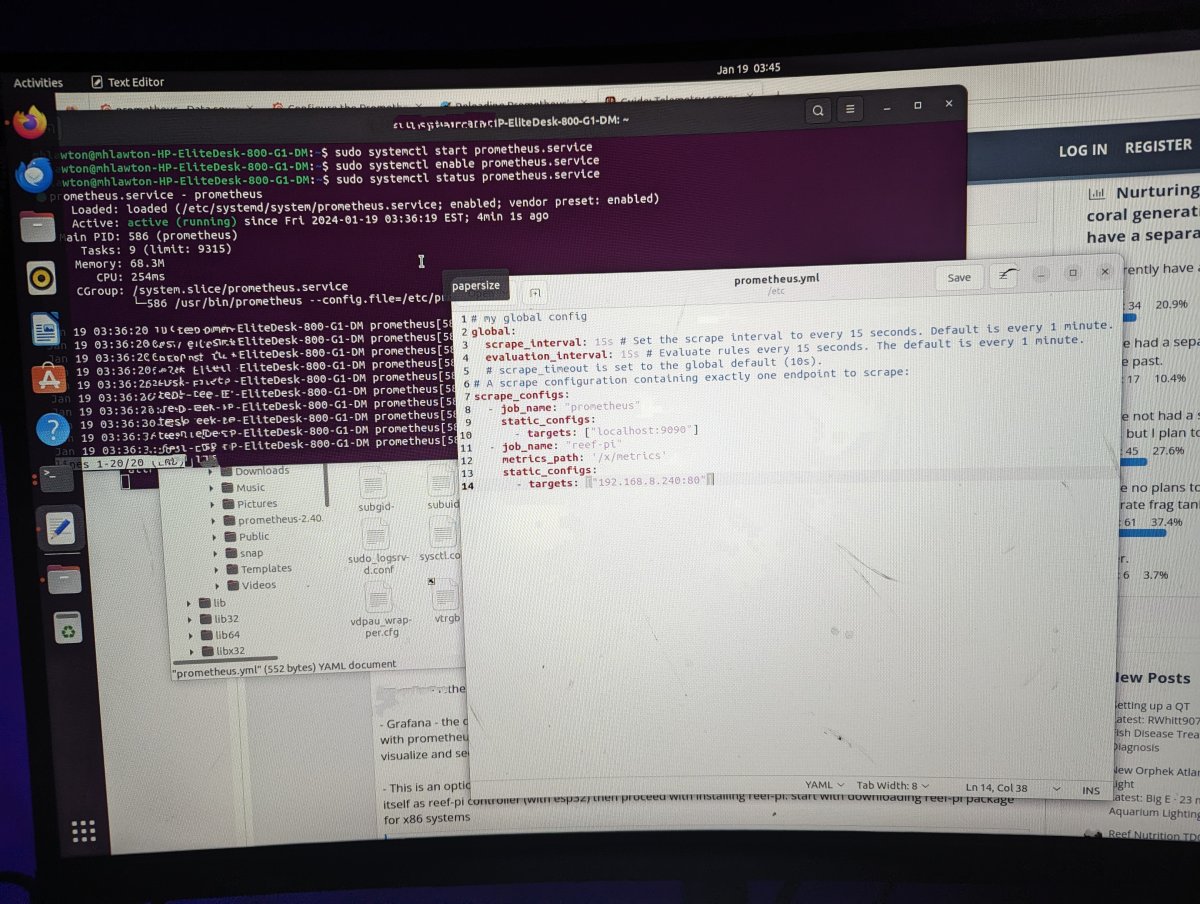
Unsure where to go from here. Thanks in advance!
Prometheus is active and the .ym file is as follows
Unsure where to go from here. Thanks in advance!
Last edited:
Similar threads
- Replies
- 8
- Views
- 622
- Replies
- 8
- Views
- 197


