
ABOUT THE ARTICLE:
The article describes an accurate and precise method and it's development, for measuring the level of Iodine in a saltwater aquarium. It is a follow-up to an article written in 2021. The current article describes an improved method but using the same basic ideas as the 2021 method. The details of the method development are included for those who might be interested. It is an informative example on how methods development can be challenging. That being said if you are just interested in the "Bottom Line" you can skip to Section VII "THE PROCEDURE". This is where the detailed procedure is described. There is also a video link there to see the procedure preformed. I hope this is helpful and you enjoy the reading.
Rick
 I. INTRODUCTION
In December of 2019 I posted an article “USING THE HANNA CHECKER HI-707 TO TEST FOR IODINE”… You can read it here:
https://www.reef2reef.com/ams/using-hanna-checker-hi-707-to-test-for-iodine.743/
It might be helpful to read it because it has some additional background information.
In using this test method I found, although it worked, it was not satisfactory for the lower levels of Iodine (< .02-.03 ppm). The procedure put the measurement results up near the upper end of the meters measurement range (600ppm.) In addition while working on a separate project @taricha found the measured values to be off more than the test protocol predicted. This would have been the first hint that there is something protocol that was not solid.
This started us (@Dan_P, @taricha and me) on a quest to modify the existing procedure, which I thought would be a “piece of cake”. Little did we know that this “piece of cake” would take us down a rabbit hole that has taken many interesting turns and detours!!
I worked on the initial efforts by working with the reaction time and the levels of the Red Sea Reagent. This helped us to determine the time and reagent amounts that would move measurement range closer to the center of the range. Table 1 and Chart 1 show the results. (See REAGENT AMOUNTS SECTION for details). What follows are the account and some details of the procedure development and information necessary to do this test yourself.

TABLE 1

CHART 1
If you wish to join us in a trip down the rabbit hole, keep on reading. If not you can skip to the end and find a detailed step by step procedure to run the test for Iodine…Here we go!

II. INITIAL PROCEDURE DEVELOPMENT
In this section we will describe the steps in the initial procedure development. These will include:
THE RED SEA REACTION VARIABLES
The Red Sea reaction is very time dependent. In order to get accurate and precise results close attention to the reaction time is important. Chart 2, provided by @taricha shows the time dependence of the reaction at various ppm levels of iodine.

CHART 2
Here is a link to a time laps video showing the reaction over time. It plots Absorbance over time. It also shows a visual of the reaction over time.
The reaction is temperature dependent as can be seen from Chart 3. We will cover this in a bit more detail in section on MODIFIED PROCEDURE DEVELOPMENT. The outcome of this temperature dependency is a need to know the temperature of the sample being tested.

CHART 3
Here is a link to a video showing the reaction at different temperature. I plots change in Absorbance over time at 3 different temperatures. You can also see a visual of the reaction overt time compared to the initial color of the sample
There is a very slight salinity effect but the impact on the measurement and the calculation is minimal and I did not include it in the calculation. Chart 4 shows the salinity effect. The differences in the measurement due the salinity effect were small enough that there is no adjustment made in the regression.

CHART 4
The Red Sea reaction requires 2 reagents. When both reagents are added an orange color develops. The intensity of this orange color is dependent on the amounts of the reagents used. By reducing the amounts to 75% (3/4) their initial levels with a 4 minute reaction time I was able to obtain a more reasonable measurement range. This can be seen in Chart 5 as well as Chart 1 in the introduction. The orange trend line has a much broader range of meter measurements than the other trend lines which represents different reaction times and reagent levels.

CHART 5
This was not evaluated in the initial Procedure Development. We assumed this would not be an issue, which turned out to be a very bad assumption. (See PROCEDURE REPLICATION section)
Three sets of standards were prepared. Two we made with potassium iodide (KI) and one was made with potassium iodate KIO3. Four levels were prepared: 0 ppm, .02 ppm, .04 ppm, .06 ppm and .1 ppm. They were prepared according to the procedure described in the December 2019 article. https://www.reef2reef.com/ams/using-hanna-checker-hi-707-to-test-for-iodine.743/
The samples were measured using the Hanna Checker HI-707 according to the following procedure:
The measurement data was collected from the measurement sets and recorded. See Table 2 for the results. Only the results of the potassium Iodide are given.

TABLE 2
Using the data from Table 2 and the Excel Data Analysis Regression function, the regression function was calculated. Chart 6 is a plot of 3 regressions. The red is the new procedure using a 4 minute reaction time with 3/4 reagent level (Data from Table 2). The green is the old regression and the blue is the new procedure but using potassium iodate (Red Sea STD) as the standards. The red and blue regressions are generated from additional data sets not included here.
It can be seen from these results that there is good agreement between the two different standards ….Potassium Iodide and Potassium Iodate.

CHART 6
The regression equation selected was: (Includes Temperature Correction)
Y = (-0.0003339038*(((TEMP-79)*3.5) +X)) +.1452396
This was generated using the program MyCurve Fit with the same data set.
These are the results that we were attempting to replicate in the PROCEDURE REPLICATION/ VALIDATION step. This is where things went off the rail and opened up a whole new rabbit hole!
III. PROCEDURE REPLICATION/VALIDATION
As is my usual practice I presented my findings along with the procedure to @Dan_P and @taricha for review and replication….This was the entrance to quite a deep rabbit hole!
Although it was expected that “tweaking” might be necessary, it was not expected to run into so many difficulty replication my results. It would have been acceptable to have a 5 or even 10% deviation from my results, but there was a 25-35% deviation….Not acceptable. The puzzling thing was it was very consistent. It was in the same direction and the same magnitude every time. This indicated a systematic error…But where? This lead us to look at everything from standards preparation, step by step procedure validation, reagent variability, time and temperature effects, instrument validation and a host of others. We exchanged samples, standards and procedural notes and videos all searching find where the variability came from.
To shorten the story it ended up that there were 2 culprits…Reagent variability (See Chart 7) and temperature variations (See Chart 3 & 8). The temperature variation was manageable. The previous procedure had a temperature correction component so we expected this modified procedure would need one also. However, the reagent variability presented a big hurdle because this was outside of our control. The variation is large enough that without a solution to the problem the test would not be useful. One solution was to “test” the regression every time there was a new lot, and if it was not acceptable generate a new regression using a 2 point calibration. This is really not practical and makes the tests much more cumbersome….Seemed as though we were stuck...Ah…The story continues... @taricha to the rescue!!

CHART 7

CHART 8The solution to the reagent variability problem came while @taricha was pondering the reaction as a function of time and noted that rate at which the reaction proceeded (loss of color—color destruction) from one set time to another was proportional to the iodine concentration. The logic can be seen in Charts 9-11

CHART 9
SPECTRAL ABSORBANCE OF 3 DIFERENT LOTS OF REAGENT
Chart 9 illustrates lot to lot variability. Looking at the absorbance value of each lot at the 240 seconds at 3 different iodine concentration levels shows the lot variation to be so large that the test is not useable.

CHART 10
REACTION TIME SLOPES
@taricha looked at the Time Slopes (Abs units/sec) (Chart 10) the results tightened up but not tight enough to yield solid testing results.
The breakthrough came when he realized the reaction in each lot was “destroying” close to the same proportion of the initial maximum color (0 ppm) per second. He took the initial measurement subtracted the end point measurement and divided this by the initial measurement. This produced a ratio representing the portion of the color “destroyed” (loss of color), which we later designated “Fraction of Color Destroyed” FCD. Chart 11 shows the results, almost perfect agreement...we could now proceed!

CHART 11
When we used the FCD the two reagent lots were almost identical in their prediction of the level of iodine in the sample. This opened the door for a meaningful method to modify the Initial Procedure Developed and get excellent replication results.
During this stage we modified the time segment to an end point of 3 minutes (180 Sec.). This shortened the testing time and moved the end point away from the low meter reading at high iodine concentrations. Chart 12 illustrates this.

CHART 12
This section will cover; Sample Measurement, Data Collection and Regression Generation. The findings we uncovered during our trip down the rabbit hole of “Procedure Replication” will be applied to the sample measurement. The new independent variable will now be the “Fraction of Color Destroyed” (FCD). The total reaction time will be reduced to 3 minutes. All the other variables will remain the same. See comparative descriptions below to get a better picture.

 NOTE: This is not a detailed step by step of the procedure. That can be found in section VII
This modified procedure was used to generate the information that follows.
The standards were prepared using reagent grade Potassium Iodide at the following levels in PPM. 0, .03, .06, .09, .12. This was changed from the initial procedure development to better handle data for procedure replication. Again more details can be found in the December 2019 article here: . https://www.reef2reef.com/ams/using-hanna-checker-hi-707-to-test-for-iodine.743/
SAMPLE MEASUREMENT (These were the prepared Standards)
The samples were measured using the Hanna Checker HI-707 according to the following procedure:
DATA COLLECTION
The data Table 3 below is a tabulation of the data generated from the sample measurements.

TABLE 3
Using the data from Table 3 and the Excel Data Analysis Regression function, the regression function was calculated. Chart # 13shows the Excel Regression output.

CHART 13
The selected regression equation was generated from the combined data sets of 11/2 and 11/15. The data from the 11/2 by itself sample set was also included to see the repeatability of the procedure. As you can see the agreement is quite good.
The resulting regression is Y= .2544 X -.0005 (No temperature correction applied)
Y = the PPM Iodine in the sample
X = the FDC Ratio
The next section shows the step by step calculations.
VII. STEP BY STEP PROCEDURE
1) Hanna HI-707 Nitrite LR Checker
2) Red Sea Iodine Pro Reagents A & B
3) Two Hanna Checker Vials (These should be matched vials) (1)
4) Timer
5) Accurate Pipette(s) or Syringe capable of measuring .38 mL and .6 mL
6) RODI Water for rinsing vials & pipettes
7) Accurate Thermometer
8) Sample Water Container (I use a beaker or plastic bottle)
The procedure itself may appear to be a little complicated, but the reality is there are only 5 components to the test and takes only about 7-9 min to do.

PROCEDURE STEP BY STEP (See Video Link below)
Calculate the Iodine PPM using Measured Temp and FCD and regression equation.
REGRESSION EQUATION
HERE IS THE LINK TO THE VIDEO OF THE PROCEDURE ---
V. THE CALCULATION
This section will describe the calculations using the generated regression. The temperature correction will be incorporated into the calculations. Don’t be intimidated by the math. It looks a lot more complicated than it really is. There is a step by step for each of the calculations; the temperature corrected version as well as no temperature correction. If you are familiar with Microsoft Excel it can make life simple for you. I have A SPREADSHEET that does all the calculations. If you are interested PM me and I will give you a link to download.
PPM IODINE =(.2544 X FDC) -.0005
1 Min Measured Value on HI-707 (M1) =377
3 Min Measured Value on HI-707 (M2)= 287
FDC Ration = (M1-M2)/M1
Step 1----Calculate FDC Ratio from M1 & M2 above (377-287)/ 377 = .239
Step 2----Multiply FDC value from step 1 by .2544 (.2544 X .239) = .0608
Step 3----Subtract .0005 from results of step 2 (.0608 - .0005) =.0603ppm Iodine
NOTE: Because .0005 is such a small value it could be ignored to simplify the calculation but it might be important at higher concentrations of Iodine where the FDC is very small.
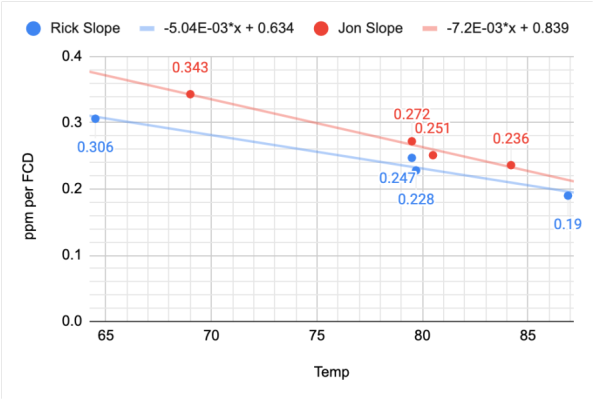
@taricha reworked the temperature effect data and incorporated the new FCD data. He took two sets of data in which the samples were tested at different temperatures and different iodine levels and noted the change in slope due to the temperature of the sample. He then plotted the slopes of the separate curves vs. temperature for the two sets of samples. The results can be seen below in Chart 15

The blue line suggests a slope of -.0050 per degree F higher than the target temperature of 79F and the red line suggests a -.0072 per degree F higher. We selected the average of these two results of -.0061
The temperature correction is an adjustment to the slope of the regression line of - .0061/⁰F from the initial calibration temperature of 79⁰F. The proposed regression with the temperature correction looks like this:
PPM IODINE = ((0.2544-(0.0061*(Temp-79)))*FDC)-0.0005
1 Min Measured Value on HI-707 (M1) =377
3 Min Measured Value on HI-707 (M2)= 287
FDC Ratio = (M1-M2)/M1
Measured Sample Temperature in ⁰F= 70
Step 1----Calculate FDC Ratio from M1 & M2 above (377-287)/ 377 = .239
Step 2---- Subtract 79 from current measured Temp (70-79) = -9
Step 3----Multiply results of Step 1 by .0061 (-9 X .0061) = -.0549
Step 4 ----Subtract the results of Step2 from .2544 (.2544 – (-.0549) = .3093
NOTE: -(-.0549) is same as +.0549 because minus a minus is a plus
Step 5 ---Multiply results of Step 3 by .239 (FDC Ratio) (.3093 X .239) = .0739
Step 6 ---Subtract .0005 from results of Step 4 (.074 - .0005) = .0734ppm Iodine
NOTE: Because this is such a small value this step can be skipped in most cases unless the results of Step 4 is a very small number (< .01)
Table 4 shows the effect of applying the temperature correction. The average error is reduced in the full temperature range tested. It is most effective at the lower and elevated ranges. For temperatures in the range of 79 ± 2⁰F a correction is most likely not necessary.

TABLE 4
In this next section we take a look at the Precision and Accuracy of the procedure
VI. PRECISION/ACCURACY AND VARIANCE ANALYSIS OF REGRESSION
For those of you who might be interested (it gets a little Geeky), I have included this section that essentially describes the ability of the test protocol to predict accurately and repeatably (precision) the actual ppm of iodine in the test samples. The targets used for accuracy are the prepared standards at the 5 different levels. Although these are not by any means NIST (1) quality standards, they were validated by @Dan_P and @taricha and were prepared using reagent grade Potassium Iodide. We are quite confident that the standards are good. That being said a actual NIST (1) traceable iodine standard will be arriving shortly and we will see how good we are at making standards.
Relative Accuracy: Relative Accuracy is how close a measured value is to a standard value. In our case it is the value of the prepared standards. The result is expressed in percent, the higher the percentage the more accurate you measurement. As noted above the quality of the standards is important in establishing “true” accuracy.
Precision: Precision is how close the measurement of the same sample is to each other. Precision is independent of Accuracy. The results are reported by an expected ± value from the mean
Relative Standard Deviation is a measure of how wide the data is scattered around the mean. If the number is high it means the numbers are widely spread, which means lower precision. If the number is low then the data is much closer together and precision is higher.
Table 5 summarizes the Precision and Accuracy results by level of iodine concentration. The standard used to check accuracy and precision are NIST traceable. These results indicate we have a pretty solid and dependable test. The limits of detection were calculated to be .014ppm which could be why the 0-.02ppm levels have greater error.

These results are based on 8 individual test results at each level, 40 different tests. I will not include the data sets, but if you are interested I can provide them.
Once a regression is selected it is a good idea to assess the quality of the results. This is referred to as regression statistics and is briefly described below. Table 6 describes the regression statistics for the regression generated from the data in Table 3. This information indicates the regression is quite solid and a good predictor of the desired outcome…PPM Iodine.


I thought it also might be interesting to look at the new test procedure using the methods described in the Article “How We Use ICP- OES Results of Unknown Accuracy and Precision” and see how it compared to the results of the ICP vendors as well as the old test procedure. The results can be seen in Chart 14. The results are very favorable and indicate the new test protocol performs at high precision.
If you really want to Geek Out below is the ANOVA data to ponder. I will not go into any details except to say it tells a “Good Story” about the quality of the regression and its ability to predict the level of iodine in sample of saltwater.

Well that about covers it. I think having an accurate and repeatable test for Iodine is an important tool to have for Reef Keeping. There are a number of us who dose iodine. Having a method to measure is very important. This test should fit the bill. Thank you for taking the time to read this article…Your comments are welcomed.
This project was a collaborative effort with @Dan_P and @taricha. Their efforts were key in bringing this project to a successful conclusion. There were times when we were at an impasse and it appeared we not going to be successful, but their innovative spirit and tenacity pulled us through. We are most fortunate to have them as contributors to our R2R family
The article describes an accurate and precise method and it's development, for measuring the level of Iodine in a saltwater aquarium. It is a follow-up to an article written in 2021. The current article describes an improved method but using the same basic ideas as the 2021 method. The details of the method development are included for those who might be interested. It is an informative example on how methods development can be challenging. That being said if you are just interested in the "Bottom Line" you can skip to Section VII "THE PROCEDURE". This is where the detailed procedure is described. There is also a video link there to see the procedure preformed. I hope this is helpful and you enjoy the reading.
Rick
In December of 2019 I posted an article “USING THE HANNA CHECKER HI-707 TO TEST FOR IODINE”… You can read it here:
https://www.reef2reef.com/ams/using-hanna-checker-hi-707-to-test-for-iodine.743/
It might be helpful to read it because it has some additional background information.
In using this test method I found, although it worked, it was not satisfactory for the lower levels of Iodine (< .02-.03 ppm). The procedure put the measurement results up near the upper end of the meters measurement range (600ppm.) In addition while working on a separate project @taricha found the measured values to be off more than the test protocol predicted. This would have been the first hint that there is something protocol that was not solid.
This started us (@Dan_P, @taricha and me) on a quest to modify the existing procedure, which I thought would be a “piece of cake”. Little did we know that this “piece of cake” would take us down a rabbit hole that has taken many interesting turns and detours!!
I worked on the initial efforts by working with the reaction time and the levels of the Red Sea Reagent. This helped us to determine the time and reagent amounts that would move measurement range closer to the center of the range. Table 1 and Chart 1 show the results. (See REAGENT AMOUNTS SECTION for details). What follows are the account and some details of the procedure development and information necessary to do this test yourself.
TABLE 1
CHART 1
II. INITIAL PROCEDURE DEVELOPMENT
In this section we will describe the steps in the initial procedure development. These will include:
- Analysis of the variables of the Red Sea reaction
- How the standards used in the test development were prepared
- Sample measurement and data collection
- Regression generation
- Procedure replication and Validation
THE RED SEA REACTION VARIABLES
TIME:
The Red Sea reaction is very time dependent. In order to get accurate and precise results close attention to the reaction time is important. Chart 2, provided by @taricha shows the time dependence of the reaction at various ppm levels of iodine.
CHART 2
Here is a link to a time laps video showing the reaction over time. It plots Absorbance over time. It also shows a visual of the reaction over time.
TEMPERATURE
The reaction is temperature dependent as can be seen from Chart 3. We will cover this in a bit more detail in section on MODIFIED PROCEDURE DEVELOPMENT. The outcome of this temperature dependency is a need to know the temperature of the sample being tested.
CHART 3
SALINITY
There is a very slight salinity effect but the impact on the measurement and the calculation is minimal and I did not include it in the calculation. Chart 4 shows the salinity effect. The differences in the measurement due the salinity effect were small enough that there is no adjustment made in the regression.
CHART 4
REAGENT AMOUNTS
The Red Sea reaction requires 2 reagents. When both reagents are added an orange color develops. The intensity of this orange color is dependent on the amounts of the reagents used. By reducing the amounts to 75% (3/4) their initial levels with a 4 minute reaction time I was able to obtain a more reasonable measurement range. This can be seen in Chart 5 as well as Chart 1 in the introduction. The orange trend line has a much broader range of meter measurements than the other trend lines which represents different reaction times and reagent levels.
CHART 5
REAGENT VARIABILITY
This was not evaluated in the initial Procedure Development. We assumed this would not be an issue, which turned out to be a very bad assumption. (See PROCEDURE REPLICATION section)
STANDARDS PREPARATION
Three sets of standards were prepared. Two we made with potassium iodide (KI) and one was made with potassium iodate KIO3. Four levels were prepared: 0 ppm, .02 ppm, .04 ppm, .06 ppm and .1 ppm. They were prepared according to the procedure described in the December 2019 article. https://www.reef2reef.com/ams/using-hanna-checker-hi-707-to-test-for-iodine.743/
SAMPLE MEASUREMENT (These were the prepared Standards)
The samples were measured using the Hanna Checker HI-707 according to the following procedure:
- Sample temperatures were measured.
- The adjusted levels of reagent A (.38mL) and B (.6mL) were added to 10 mL sample
- Measurement was taken at the end of a 4 minute reaction time
- Each level of the standards was measured 4 times then an additional 4 time on second day (Total 8 measurements at each level)
DATA COLLECTION
The measurement data was collected from the measurement sets and recorded. See Table 2 for the results. Only the results of the potassium Iodide are given.
TABLE 2
REGRESSION GENERATION
Using the data from Table 2 and the Excel Data Analysis Regression function, the regression function was calculated. Chart 6 is a plot of 3 regressions. The red is the new procedure using a 4 minute reaction time with 3/4 reagent level (Data from Table 2). The green is the old regression and the blue is the new procedure but using potassium iodate (Red Sea STD) as the standards. The red and blue regressions are generated from additional data sets not included here.
It can be seen from these results that there is good agreement between the two different standards ….Potassium Iodide and Potassium Iodate.
CHART 6
The regression equation selected was: (Includes Temperature Correction)
Y = (-0.0003339038*(((TEMP-79)*3.5) +X)) +.1452396
This was generated using the program MyCurve Fit with the same data set.
These are the results that we were attempting to replicate in the PROCEDURE REPLICATION/ VALIDATION step. This is where things went off the rail and opened up a whole new rabbit hole!
III. PROCEDURE REPLICATION/VALIDATION
As is my usual practice I presented my findings along with the procedure to @Dan_P and @taricha for review and replication….This was the entrance to quite a deep rabbit hole!
Although it was expected that “tweaking” might be necessary, it was not expected to run into so many difficulty replication my results. It would have been acceptable to have a 5 or even 10% deviation from my results, but there was a 25-35% deviation….Not acceptable. The puzzling thing was it was very consistent. It was in the same direction and the same magnitude every time. This indicated a systematic error…But where? This lead us to look at everything from standards preparation, step by step procedure validation, reagent variability, time and temperature effects, instrument validation and a host of others. We exchanged samples, standards and procedural notes and videos all searching find where the variability came from.
To shorten the story it ended up that there were 2 culprits…Reagent variability (See Chart 7) and temperature variations (See Chart 3 & 8). The temperature variation was manageable. The previous procedure had a temperature correction component so we expected this modified procedure would need one also. However, the reagent variability presented a big hurdle because this was outside of our control. The variation is large enough that without a solution to the problem the test would not be useful. One solution was to “test” the regression every time there was a new lot, and if it was not acceptable generate a new regression using a 2 point calibration. This is really not practical and makes the tests much more cumbersome….Seemed as though we were stuck...Ah…The story continues... @taricha to the rescue!!
CHART 7
CHART 8
CHART 9
SPECTRAL ABSORBANCE OF 3 DIFERENT LOTS OF REAGENT
CHART 10
REACTION TIME SLOPES
The breakthrough came when he realized the reaction in each lot was “destroying” close to the same proportion of the initial maximum color (0 ppm) per second. He took the initial measurement subtracted the end point measurement and divided this by the initial measurement. This produced a ratio representing the portion of the color “destroyed” (loss of color), which we later designated “Fraction of Color Destroyed” FCD. Chart 11 shows the results, almost perfect agreement...we could now proceed!
CHART 11
When we used the FCD the two reagent lots were almost identical in their prediction of the level of iodine in the sample. This opened the door for a meaningful method to modify the Initial Procedure Developed and get excellent replication results.
During this stage we modified the time segment to an end point of 3 minutes (180 Sec.). This shortened the testing time and moved the end point away from the low meter reading at high iodine concentrations. Chart 12 illustrates this.
CHART 12
IV. MODIFIED PROCEDURE DEVELOPMENT
This section will cover; Sample Measurement, Data Collection and Regression Generation. The findings we uncovered during our trip down the rabbit hole of “Procedure Replication” will be applied to the sample measurement. The new independent variable will now be the “Fraction of Color Destroyed” (FCD). The total reaction time will be reduced to 3 minutes. All the other variables will remain the same. See comparative descriptions below to get a better picture.
This modified procedure was used to generate the information that follows.
STANDARDS PREPARATION
The standards were prepared using reagent grade Potassium Iodide at the following levels in PPM. 0, .03, .06, .09, .12. This was changed from the initial procedure development to better handle data for procedure replication. Again more details can be found in the December 2019 article here: . https://www.reef2reef.com/ams/using-hanna-checker-hi-707-to-test-for-iodine.743/
SAMPLE MEASUREMENT (These were the prepared Standards)
The samples were measured using the Hanna Checker HI-707 according to the following procedure:
- Sample temperatures were measured.
- The adjusted levels of reagent A (.38mL) and B (.6mL) were added to 10 mL sample
- Timer set for 3 minutes is started
- Measurement was taken at the end of a 1 minute reaction time and the data was recorded. This would be measurement 1-- M1
- The checker was re-zeroed
- The test sample is placed back into the Checker
- At the end of the 3 min time a second measurement is made---M2
- Each level of the standards was measured 4 times.
- This procedure was repeated a second time on a different day for a total of 8 measurements
- CALCULATION OF FCD RATIO ---FDC = (M1-M2)/M1
DATA COLLECTION
The data Table 3 below is a tabulation of the data generated from the sample measurements.
TABLE 3
REGRESSION GENERATION
Using the data from Table 3 and the Excel Data Analysis Regression function, the regression function was calculated. Chart # 13shows the Excel Regression output.
CHART 13
The selected regression equation was generated from the combined data sets of 11/2 and 11/15. The data from the 11/2 by itself sample set was also included to see the repeatability of the procedure. As you can see the agreement is quite good.
The resulting regression is Y= .2544 X -.0005 (No temperature correction applied)
Y = the PPM Iodine in the sample
X = the FDC Ratio
The next section shows the step by step calculations.
VII. STEP BY STEP PROCEDURE
EQUIPMENT REQUIRED
1) Hanna HI-707 Nitrite LR Checker
2) Red Sea Iodine Pro Reagents A & B
3) Two Hanna Checker Vials (These should be matched vials) (1)
4) Timer
5) Accurate Pipette(s) or Syringe capable of measuring .38 mL and .6 mL
6) RODI Water for rinsing vials & pipettes
7) Accurate Thermometer
8) Sample Water Container (I use a beaker or plastic bottle)
The procedure itself may appear to be a little complicated, but the reality is there are only 5 components to the test and takes only about 7-9 min to do.
PROCEDURE STEP BY STEP (See Video Link below)
- Fill vial to be used as the Blank with water to be tested.
- Place the blank into the checker
- Rinse second vial with water to be tested
- Fill second vial with water to be tested to the 10 mL line
- Measure and record sample temperature
- With the blank in the checker press the button on the Hanna Checker…When “C1” appears press again….”C2” will now be on the display.
- Remove the Blank
- Set Timer to 3 Minutes
- Add .38 mL of Red Sea reagent “A” to second vial containing the test water.
- Add .6 mL of Red Sea reagent “B’ to the second test vial
- IMMEDIATELY START TIMER!!
- Invert the vial 5-10 times to mix reagents
- Immediately place the test vial into the checker
- When the timer reaches 2 min (1 min has passed) press the button on the checker and record the Measurement. This will be your M1 value
- Press the checker button to turn off. Remove the test vial and replace it with the Blank.
- Press the checker button to turn it back on. “C1”. Press a second time to re-measure blank.
- Remove the Blank and replace it with the test vial. Wait for time to reach “0”
- When the timer reaches “0” IMMEDIATELY PRESS THE BUTTON ON THE CHECKER TO GET THE MEASUREMENT…This will be your M2 value
- Calculate Fraction of Color Destroyed (FCD)
Calculate the Iodine PPM using Measured Temp and FCD and regression equation.
PPM IODINE = ((0.2544-(0.0061*(Temp-79)))*FDC)-0.0005
REGRESSION EQUATION
V. THE CALCULATION
This section will describe the calculations using the generated regression. The temperature correction will be incorporated into the calculations. Don’t be intimidated by the math. It looks a lot more complicated than it really is. There is a step by step for each of the calculations; the temperature corrected version as well as no temperature correction. If you are familiar with Microsoft Excel it can make life simple for you. I have A SPREADSHEET that does all the calculations. If you are interested PM me and I will give you a link to download.
EXAMPLE (#1) CALCULATIONS WITHOUT TEMPERATURE CORRECTION
PPM IODINE =(.2544 X FDC) -.0005
1 Min Measured Value on HI-707 (M1) =377
3 Min Measured Value on HI-707 (M2)= 287
FDC Ration = (M1-M2)/M1
Step 1----Calculate FDC Ratio from M1 & M2 above (377-287)/ 377 = .239
Step 2----Multiply FDC value from step 1 by .2544 (.2544 X .239) = .0608
Step 3----Subtract .0005 from results of step 2 (.0608 - .0005) =.0603ppm Iodine
NOTE: Because .0005 is such a small value it could be ignored to simplify the calculation but it might be important at higher concentrations of Iodine where the FDC is very small.
TEMPERATURE EFFECT (correction)
@taricha reworked the temperature effect data and incorporated the new FCD data. He took two sets of data in which the samples were tested at different temperatures and different iodine levels and noted the change in slope due to the temperature of the sample. He then plotted the slopes of the separate curves vs. temperature for the two sets of samples. The results can be seen below in Chart 15
CHART 14
The blue line suggests a slope of -.0050 per degree F higher than the target temperature of 79F and the red line suggests a -.0072 per degree F higher. We selected the average of these two results of -.0061
The temperature correction is an adjustment to the slope of the regression line of - .0061/⁰F from the initial calibration temperature of 79⁰F. The proposed regression with the temperature correction looks like this:
PPM IODINE = ((0.2544-(0.0061*(Temp-79)))*FDC)-0.0005
EXAMPLE #2 CALCULATIONS WITH TEMPERATURE CORRECTION
1 Min Measured Value on HI-707 (M1) =377
3 Min Measured Value on HI-707 (M2)= 287
FDC Ratio = (M1-M2)/M1
Measured Sample Temperature in ⁰F= 70
Step 1----Calculate FDC Ratio from M1 & M2 above (377-287)/ 377 = .239
Step 2---- Subtract 79 from current measured Temp (70-79) = -9
Step 3----Multiply results of Step 1 by .0061 (-9 X .0061) = -.0549
Step 4 ----Subtract the results of Step2 from .2544 (.2544 – (-.0549) = .3093
NOTE: -(-.0549) is same as +.0549 because minus a minus is a plus
Step 5 ---Multiply results of Step 3 by .239 (FDC Ratio) (.3093 X .239) = .0739
Step 6 ---Subtract .0005 from results of Step 4 (.074 - .0005) = .0734ppm Iodine
NOTE: Because this is such a small value this step can be skipped in most cases unless the results of Step 4 is a very small number (< .01)
Table 4 shows the effect of applying the temperature correction. The average error is reduced in the full temperature range tested. It is most effective at the lower and elevated ranges. For temperatures in the range of 79 ± 2⁰F a correction is most likely not necessary.
TABLE 4
In this next section we take a look at the Precision and Accuracy of the procedure
VI. PRECISION/ACCURACY AND VARIANCE ANALYSIS OF REGRESSION
For those of you who might be interested (it gets a little Geeky), I have included this section that essentially describes the ability of the test protocol to predict accurately and repeatably (precision) the actual ppm of iodine in the test samples. The targets used for accuracy are the prepared standards at the 5 different levels. Although these are not by any means NIST (1) quality standards, they were validated by @Dan_P and @taricha and were prepared using reagent grade Potassium Iodide. We are quite confident that the standards are good. That being said a actual NIST (1) traceable iodine standard will be arriving shortly and we will see how good we are at making standards.
PRECISION AND ACCURACY
Relative Accuracy: Relative Accuracy is how close a measured value is to a standard value. In our case it is the value of the prepared standards. The result is expressed in percent, the higher the percentage the more accurate you measurement. As noted above the quality of the standards is important in establishing “true” accuracy.
Precision: Precision is how close the measurement of the same sample is to each other. Precision is independent of Accuracy. The results are reported by an expected ± value from the mean
Relative Standard Deviation is a measure of how wide the data is scattered around the mean. If the number is high it means the numbers are widely spread, which means lower precision. If the number is low then the data is much closer together and precision is higher.
Table 5 summarizes the Precision and Accuracy results by level of iodine concentration. The standard used to check accuracy and precision are NIST traceable. These results indicate we have a pretty solid and dependable test. The limits of detection were calculated to be .014ppm which could be why the 0-.02ppm levels have greater error.
TABLE 5
These results are based on 8 individual test results at each level, 40 different tests. I will not include the data sets, but if you are interested I can provide them.
VARIANCE ANALYSIS
Once a regression is selected it is a good idea to assess the quality of the results. This is referred to as regression statistics and is briefly described below. Table 6 describes the regression statistics for the regression generated from the data in Table 3. This information indicates the regression is quite solid and a good predictor of the desired outcome…PPM Iodine.
TABLE 6
ANOVA (ANALYSIS OF VARIANCE)
Pulling this all together, given the results of the Precision and Accuracy as well as the Regression Analysis, it appears that this is a very solid test procedure and could be useful in measuring the level of iodine in our Reef tanks.I thought it also might be interesting to look at the new test procedure using the methods described in the Article “How We Use ICP- OES Results of Unknown Accuracy and Precision” and see how it compared to the results of the ICP vendors as well as the old test procedure. The results can be seen in Chart 14. The results are very favorable and indicate the new test protocol performs at high precision.
If you really want to Geek Out below is the ANOVA data to ponder. I will not go into any details except to say it tells a “Good Story” about the quality of the regression and its ability to predict the level of iodine in sample of saltwater.
CHART 14
VIII. CONCLUSIONWell that about covers it. I think having an accurate and repeatable test for Iodine is an important tool to have for Reef Keeping. There are a number of us who dose iodine. Having a method to measure is very important. This test should fit the bill. Thank you for taking the time to read this article…Your comments are welcomed.
This project was a collaborative effort with @Dan_P and @taricha. Their efforts were key in bringing this project to a successful conclusion. There were times when we were at an impasse and it appeared we not going to be successful, but their innovative spirit and tenacity pulled us through. We are most fortunate to have them as contributors to our R2R family