Hi all. I've been a long time lurker getting lots of useful info off the forum to set up my first tank. I got some personal help last week with a fish diagnosis so I was looking for some way to give back to the community.
I am color blind which makes reading most test kits impossible. I have been using all Red Sea test kits. I can see the color change on the Alkalinity if I do 0.5 dkH increments but that is it. The rest I have are pink to blue color changes and I just can't see the red.
To get around this I use a phone app that takes the sensor color from a few pixels of the camera and outputs the RGB (Red, Green, Blue) values live on the screen. It will also do some translation of the RGB values and interpret them to a color name. My current phone is a Samsung Galaxy S8+ and the free App I have been using is called "Color Grab". The only issue I have had is that occasionally it seems like the colors on the phone will "shift" and aren't the values I expect for a given test. A phone reboot will usually fix this (and require a repeat test).
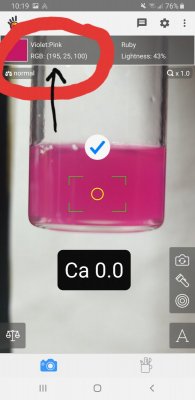
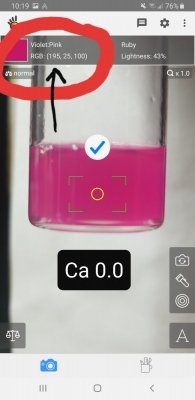
The screen grab of the app screen (with the large red circle in the top left) shows a target circle in the middle of the screen. It gives live value of the RGB (red, green, blue) values in the top left corner and a translated color name (Violet: Pink in this picture). For my tests I will watch the RGB values and wait for them to stabilize at each step.
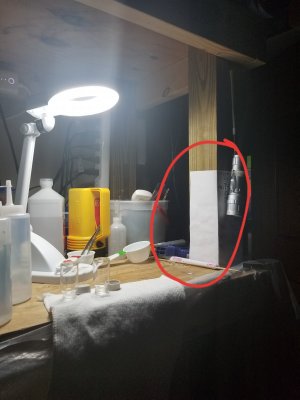
For a testing location I have a Harbor Freight magnifying light angled towards a white piece of paper on my work area that I use for a backdrop (there is a picture of this with a circle around the backdrop). Distance from the phone to the test piece is around 6-8 inches. The distance between the vial and the camera can effect the color so I try to maintain the same distance throughout the test and keep the dot on the same location on the vial. Sometimes the camera will have difficulty getting a good focus but this doesn't seem to effect the color (blue is blue whether in focus or not).
Disclaimer: there are some very detailed testing procedures on the forum where individuals mix up a solutions to a known value, do repeat testing, determine testing error, etc. This is not one of those. In my tests I pick a standard color threshold that I use to end my test. I feel I can repeat this value test to test. This allows me to target my parameters at a stable value, however, what I am calling calcium of 400 may actually be higher or lower than 400 depending on when you call the testing "done". I just try to make sure I am in the ball park of target values and then keep it stable. I would have to mix up known concentrations to get a true correlation. It is the same issue that someone trying to judge the color change would have. The methods could definitely be used to produce a more accurate absolute value with some care and testing because the color change can be quantified to a number.
Test method: I follow the standard test protocol for the test kit and then use the app for the final titration step. For the pictures shown I used a 0.02ml increment of titrant with 10 seconds of stirring/shaking per dose. I then wait 10-20 seconds for the RGB values to stabilize. It is important to hold the camera to vial distance relatively constant and to target the same spot on the sample. I don't have a test rig to hold the distance fixed, I just eyeball the size of the vial on the screen and try to keep it the same.
The tests shown below are Red Sea Pro Calcium, Magnesium, and Potassium tests. For each of these tests they change from a pink to blue color. I focus only on the Red value of the RGB (the first number) and use this to determine when my testing is complete.
I use the following thresholds to call my test complete:
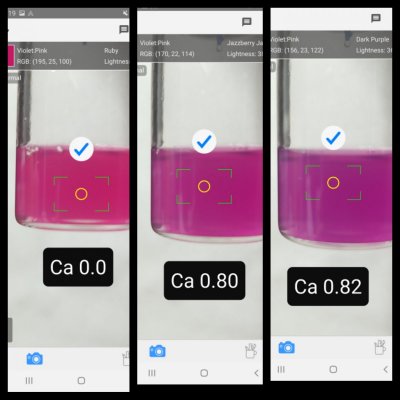
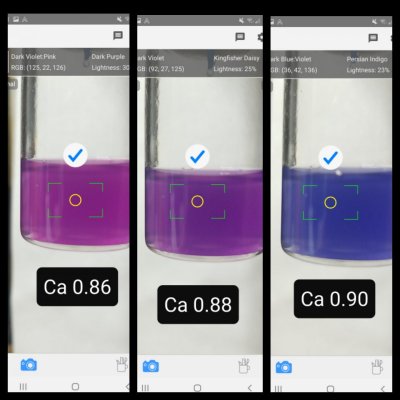
Calcium: Red < 50
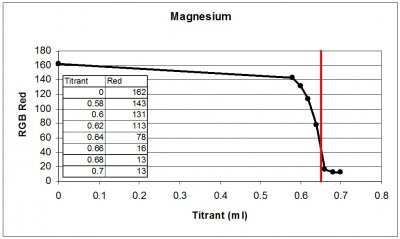
Magnesium: Red < 50
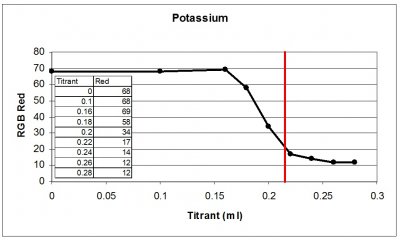
Potassium: Red < 20
These values are towards the end of the steep part of the color change. Someone with more knowledge of the chemical reactions may be able to help me with what part of the curve to target for a more absolute value.
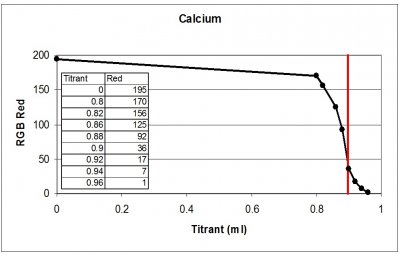
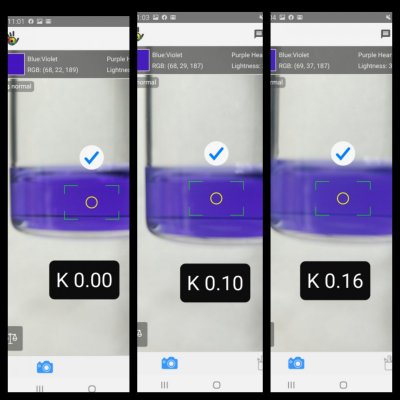
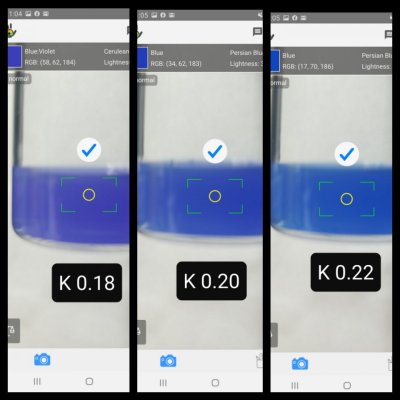
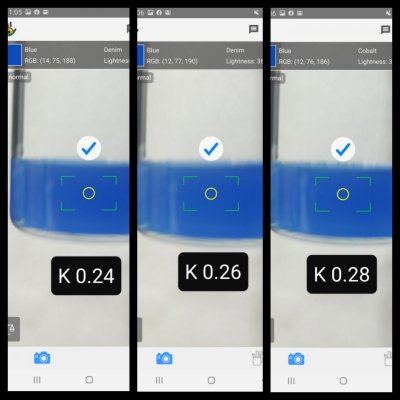
In the examples below for each test I have a plot of the amount of titrant added on the X-Axis with the Red value plotted on the Y-Axis. I also include a table of the values on the graph. For these three tests I would use a value of 0.9 for calcium (first test point with Red <50), 0.66 for Magnesium (first test point with Red <50), and 0.22 for Potassium (first test point with Red <20). From the test cards this gives me values of Calcium:450 , Magnesium:1320 , and Potassium:404.
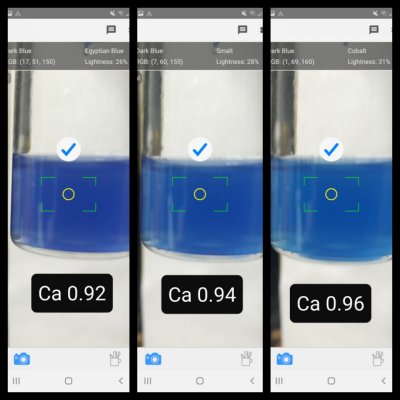
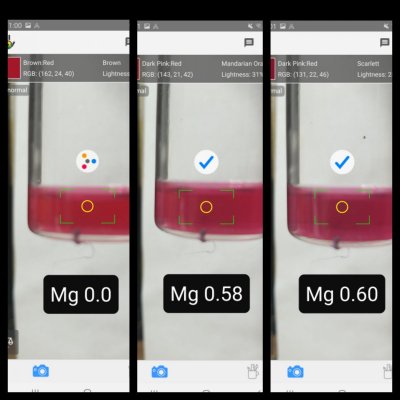
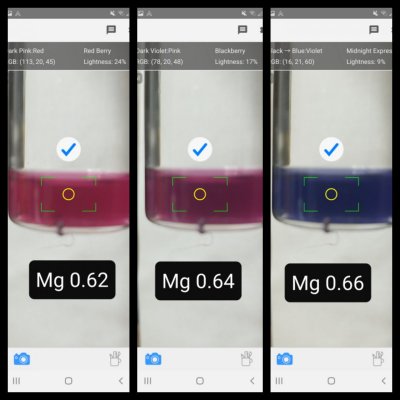
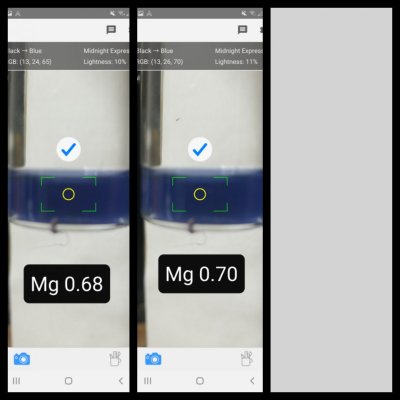
Also included are select screen grabs of the vials during the tests. In these I have added the black box with the test (Ca for calcium, Mg for Magnesium, and K for Potassium) followed by the amount of titrant added for that picture.
Enjoy,
PapaElf
Be sure to check out the great discussion on this article! (CLICK HERE!)
I am color blind which makes reading most test kits impossible. I have been using all Red Sea test kits. I can see the color change on the Alkalinity if I do 0.5 dkH increments but that is it. The rest I have are pink to blue color changes and I just can't see the red.
To get around this I use a phone app that takes the sensor color from a few pixels of the camera and outputs the RGB (Red, Green, Blue) values live on the screen. It will also do some translation of the RGB values and interpret them to a color name. My current phone is a Samsung Galaxy S8+ and the free App I have been using is called "Color Grab". The only issue I have had is that occasionally it seems like the colors on the phone will "shift" and aren't the values I expect for a given test. A phone reboot will usually fix this (and require a repeat test).
The screen grab of the app screen (with the large red circle in the top left) shows a target circle in the middle of the screen. It gives live value of the RGB (red, green, blue) values in the top left corner and a translated color name (Violet: Pink in this picture). For my tests I will watch the RGB values and wait for them to stabilize at each step.
For a testing location I have a Harbor Freight magnifying light angled towards a white piece of paper on my work area that I use for a backdrop (there is a picture of this with a circle around the backdrop). Distance from the phone to the test piece is around 6-8 inches. The distance between the vial and the camera can effect the color so I try to maintain the same distance throughout the test and keep the dot on the same location on the vial. Sometimes the camera will have difficulty getting a good focus but this doesn't seem to effect the color (blue is blue whether in focus or not).
Disclaimer: there are some very detailed testing procedures on the forum where individuals mix up a solutions to a known value, do repeat testing, determine testing error, etc. This is not one of those. In my tests I pick a standard color threshold that I use to end my test. I feel I can repeat this value test to test. This allows me to target my parameters at a stable value, however, what I am calling calcium of 400 may actually be higher or lower than 400 depending on when you call the testing "done". I just try to make sure I am in the ball park of target values and then keep it stable. I would have to mix up known concentrations to get a true correlation. It is the same issue that someone trying to judge the color change would have. The methods could definitely be used to produce a more accurate absolute value with some care and testing because the color change can be quantified to a number.
Test method: I follow the standard test protocol for the test kit and then use the app for the final titration step. For the pictures shown I used a 0.02ml increment of titrant with 10 seconds of stirring/shaking per dose. I then wait 10-20 seconds for the RGB values to stabilize. It is important to hold the camera to vial distance relatively constant and to target the same spot on the sample. I don't have a test rig to hold the distance fixed, I just eyeball the size of the vial on the screen and try to keep it the same.
The tests shown below are Red Sea Pro Calcium, Magnesium, and Potassium tests. For each of these tests they change from a pink to blue color. I focus only on the Red value of the RGB (the first number) and use this to determine when my testing is complete.
I use the following thresholds to call my test complete:
Calcium: Red < 50
Magnesium: Red < 50
Potassium: Red < 20
These values are towards the end of the steep part of the color change. Someone with more knowledge of the chemical reactions may be able to help me with what part of the curve to target for a more absolute value.
In the examples below for each test I have a plot of the amount of titrant added on the X-Axis with the Red value plotted on the Y-Axis. I also include a table of the values on the graph. For these three tests I would use a value of 0.9 for calcium (first test point with Red <50), 0.66 for Magnesium (first test point with Red <50), and 0.22 for Potassium (first test point with Red <20). From the test cards this gives me values of Calcium:450 , Magnesium:1320 , and Potassium:404.
Also included are select screen grabs of the vials during the tests. In these I have added the black box with the test (Ca for calcium, Mg for Magnesium, and K for Potassium) followed by the amount of titrant added for that picture.
Enjoy,
PapaElf


Be sure to check out the great discussion on this article! (CLICK HERE!)


